The moment you say “We are going to make a game that is a <genre> with <art-style> graphics” and commit to developing that game you have made about 90% of your marketing decisions for your game. At that moment in the multiverse of potential outcomes for your game, hundreds of doors instantly slammed shut and a few remained open. The choice has been made, your potential revenue largely decided.
Let me repeat: the type of game you make is the most important decision you will make when marketing your game. All this crap about “what day should I release on” or “how many hashtags should I use when tweeting” or “what sub reddits should I post on” is the relatively unimportant lanugo that coats the exterior of your infant game.
Unfortunately too many indies don’t spend enough time evaluating a genre and whether it has an audience on Steam. Steam players really do have a preference. Today I am going to look at several genres that are popular with indie game developers and show you what you can expect if you pick them.
Data source / methodology
I want to cut to the chase and get into it but I also want to make sure that I cover my methodology because there is always that one guy (usually on reddit) who goes “well you weren’t crystal clear about whether you are using the boxleiter modified…..”
So if you want to read the full recap you can find it in the section called “Appendix; Deep dive on methodology” below. But here is the basics:
- I used the data scraped and provided by VGI pro
- I am looking only at games from 2019 – 2022
- I am only looking at “indie” games (I filter out AA and AAA data)
- I picked what genres to graph based on what ones indies typically make
- In most graphs here I filtered out games that earned fewer than 10 reviews (This prevents Shovelware asset flips from mucking up the data.)
Again for the full reasoning skip to the Appendix.
What did you find?
From 2019 to today, 32,202 indie games were released. Of those games, 18,563 of them earned over 10 reviews. For info as to why 10 reviews are so important see this blog post.
Steam players still really like deep strategy and simulation games. They hunger for very involved games that have a complex meta. Think 4X games like Civilization, builder games like Timberborn, Survival Craft games like Valheim, and Rogulike Deckbuilders like Slay The Spire.
In my mind the typical Steam PC player likes complex games they can spend hundreds or dozens of HOURS playing. They aren’t always into fast-twitch action / arcade games unless they are fast-twitch FPS games like Counter Strike GO or Call of Duty. For more on that see the “winner take all” section .
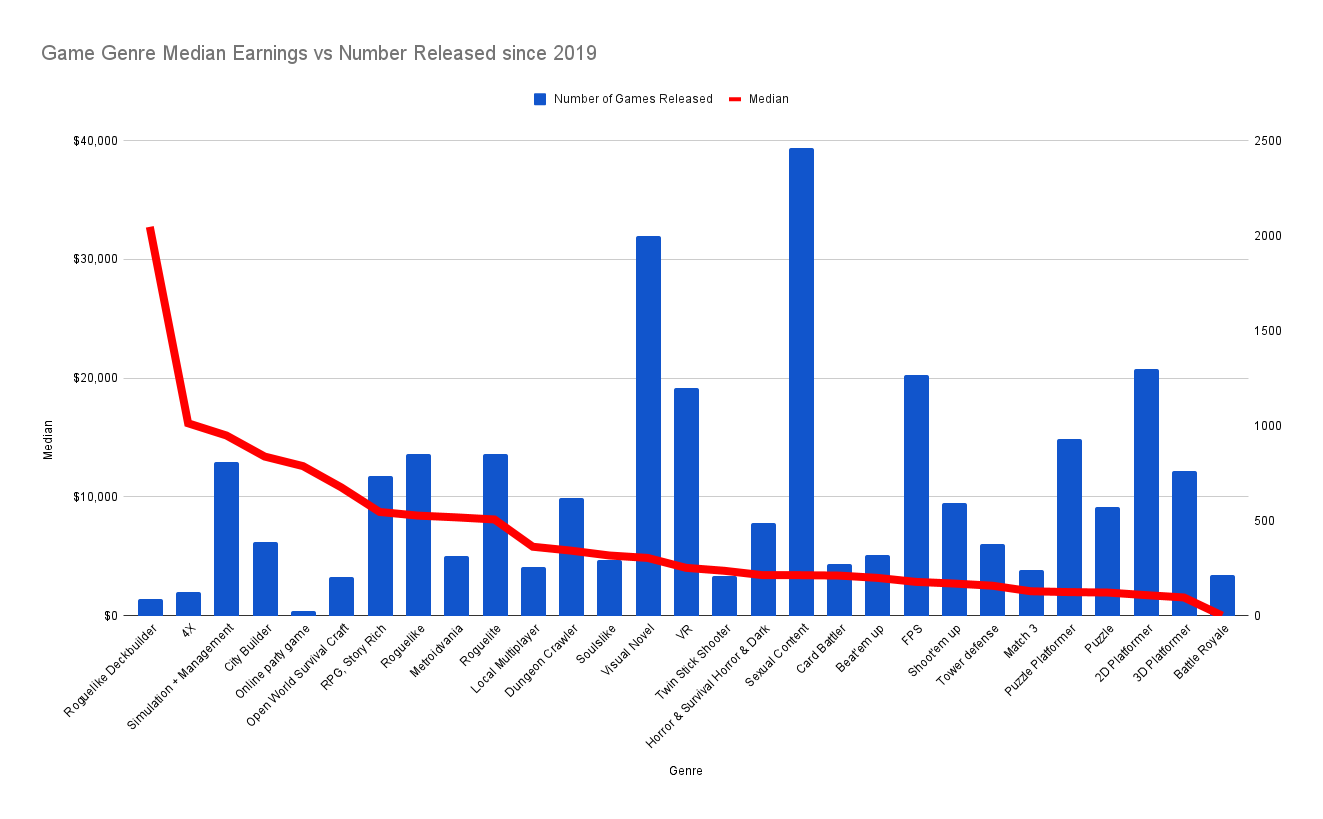
With that said, let’s look at the following graph.

The red line is the median estimated sales for each genre from Jan 2019-April 2022. The graph is sorted by median earnings. So the games on the left earn more than the games on the right.
The blue bars are the number of games with those tags released at the start of 2019 until today.
What does this mean? Indie developers are still making way too many genres that don’t do that well on Steam: mostly platformers (of all varieties), puzzle games, and FPS despite fewer gamers buying them.
In general these are genres that indies love to make despite Steam just not buying them:
- 2D Platformers
- 3D Platformers
- VR
- FPS
- Shoot’em Up
- Tower Defense.
Other surprising details:
- The tag with the most games was “Sexual Content.” There are a lot of nasty little games on Steam and they actually do alright sales wise. Morally-wise??? that is a different blog post.
- Roguelike Deckbuilder is by far the most popular tag and beats 4X for median sales! And there are only 99 games released in that genre over the last 3 years. The audience here seems insatiable and not enough devs are making purely roguelike deckbuilders.
- Despite there being a ton of Visual novels released (second most made genre) there are people buying them.
Ya but what about…
Whenever I give a talk on genres and say stuff like “VR and platformers just don’t sell very well and are really hard to market.” I always get the question “Ya but what about Superhot? That is a VR game that has sold millions!” or “Ya but what about Celeste?”
Similarly whenever indies are making pitch decks to investors, or apply for government funding, they always pull the top performers in their game’s genre to prove that their game is going to make MILLIONS!
But come on, we are all good at math. You know the survivorship airplane:

Just a few anecdotes about a game that miraculously beat the odds is not enough data to draw big conclusions from. We should look at the data. This is why I like to look at the median as well as the quartiles for each of these genres.
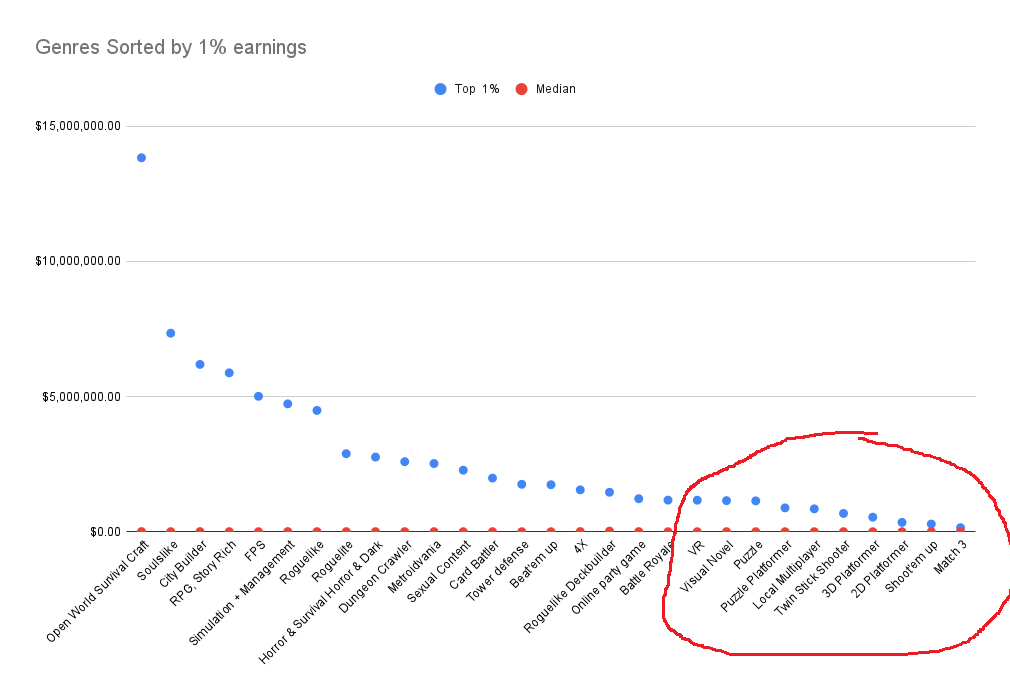
BUT! Even if we graph just the top 1% earning games (aka the Superhots and Celestes) in each genre and then sort them, VR / Platformer / Twin-stick / SHMUPS still don’t sell very well compared to the genres that are more popular on Steam. Look at this:
Winner take all genres
There are a few genres that are definite “winner take all” in which one or two games in the genre are very popular but hardly any fans play the other games. The best example of this is Battle Royale.
Fortnite is a cultural juggernaut. Apex Legends is huge. PUBG was the big catalyst of this whole genre. But after those big hitters, there are very few games that have a consistent fan base beyond that. This “winner take all” phenomenon is typical in competitive multiplayer games because fans only have time to specialize in 1 game. They don’t have time to play multiple games in the genre. Similarly, network effects of multiplayer games mean that a game is more fun as more friends and opponents play it.
If I chart each genre as a candlestick graph with it’s 1% earning, Top Quartile, Median and Bottom Quartile the “Winner Take All” games are easy to see because they generally have very long candlesticks with very tall “wicks” on the top.

(Side note I know Candle is a weird chart to use here but Google Sheets doesn’t let you do log-scale floating combo bar charts. A slightly modified candlestick was the only chart that could get me close to illustrate the scale of what is going on here).
For example look at Battle Royale on the far right. Very high 1%, but the median and bottom quartile are at the very bottom.
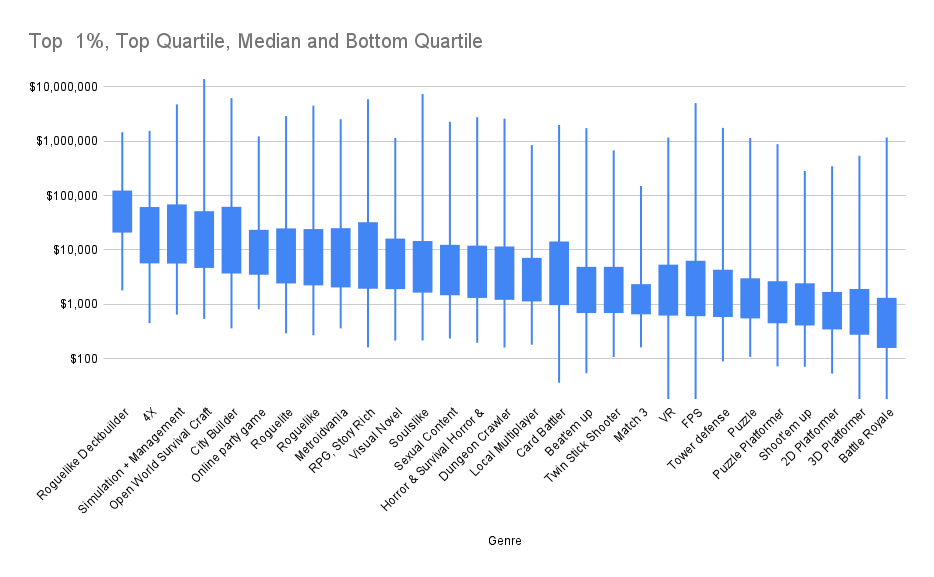
Other genres that seem to have qualities of a “winner take all” long candle are VR, FPS, and 3D Platformer. High highs. Low lows. Typically FPS games are multiplayer which leads to this all-or-nothing behavior.
The opposite of “Winner Take All” genres are those where the audience is voracious. In the graph above you can identify them because the candles are pretty short. Fans of these genres want to play every single game in the genre. Releasing games in these genres are not as cut-throat; there is not a zero-sum-game where if you win everyone else loses.
Genres such as Roguelike Deckbuilder, Visual Novel, Couch-Coop, and 4X have audiences that are more likely to try more than just 1 game.
What to do with this information?
note: In the first version of this post i gave some quick off the cuff advice that didn’t get to the nuance and detail I strive to provide. I missed the mark and got some great input from some folks on how I could make it better but it will take its own dedicated abalysis to properly cover it in a future post. Stay tuned.
But will this last?
The industry moves fast. New technology comes and goes. So one question I often get is “Well I won’t be releasing my game for another 3 years, why even study this stuff because it will change anyway? Everything is random!”
I will have a more definitive answer to this question in my next blog post, so stay tuned….
But in general, audience tastes don’t change that rapidly. PC gamers have always loved deep complex simulation games. My favorite games when I was 16 were Civilization II and SimCity. Fast forward almost 3 decades later and the top genres are still 4X grand strategy and city builders.
Rogue was developed and went viral on mainframe computers. And yet, decades later it is still one of the best selling genres.
Platformers, on the other hand, have never really been that popular on PC. Platformers are mostly the domain of Nintendo and console players. There is actually very little overlap between those two camps.
Things don’t really change that much that fast. The only thing that changes is new genres are added to the collection of “popular” genres. For instance deck builders and open world survival craft are wildly popular but are really fairly new (within the last couple of decades).
Building a platformer now with the hope that the genre will suddenly become super popular is like trying to fill an inside straight in poker. Very risky.
Appendix: Deep dive on methodology
The charts in this blog use the data set provided by Video Game Insights premium edition. For this data I filtered the games to only look at “Indie” games (and exclude AAA and AA games). For more information on how VGI determines what is an Indie game see this methodology page.
When you see sales data it is just an estimate using the VGI “customized Boxleiter method.” For more information on how VGI estimates the sales numbers see this.
In all my graphs you will see several genres graphed against each other. What is behind the genres I picked? Nothing scientific here, I have just been around in the indie space for a while and I see a lot of indies making games in these genres. They are just generally “indie favorites.” I didn’t graph Real Time Strategy games because I don’t see many indies making those.
To look at the genre numbers I just used the tags that were assigned to the games in steam. It isn’t perfect but it is what we have. There are some games that have tags in multiple genres. There are some games that are incorrectly tagged. There are some genres that just don’t have a clear tag for them.
For instance those online couch coop games like Overcooked and Gang Beasts just don’t have a single definitive tag. So I narrowed down that genre by using the tags of Casual + Co-op + Funny + Multiplayer + Party Game.
Similarly, the “Simulation” tag is used so much that it is almost useless. I wanted to specifically look at games like Euro Truck Simulator, Care Detailing Simulator, and Farming Simulator. For those games I used a combo tag of Simulator + Management.
I also limited the data set to be just games released from January 2019 to April 2022. In 2019 Valve made a number of modifications to the Steam algorithm that reduced visibility for games in the bottom ⅓ of sales and drastically increased visibility for the top ⅓. I didn’t want to get people’s hopes up by graphing a bunch of games that don’t do well in today’s marketplace. For more information on Valve’s 2019 algorithm change, read their blog post on it here.
Look at this graph. This is the official Valve chart that says we reduced the earnings for games in the bottom 30th percentile and increased them for games in the 31-100th percentile.
