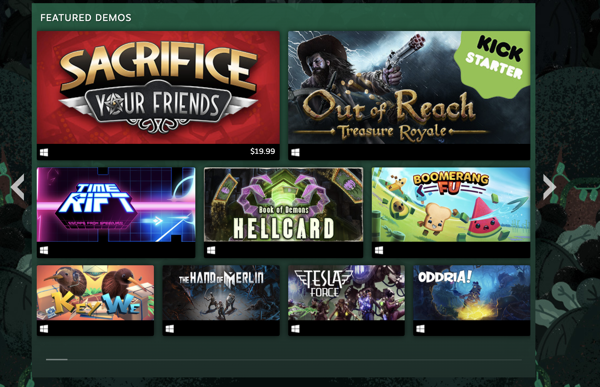
Last month Valve launched the Steam Summer Festival. It was a virtual event where developers could upload a free, playable demo to Steam. Valve collected all games and from June 16- June 22nd featured a special Summer Festival Page showcasing all the submitted games. No game was turned away and Valve estimated that the festival had over 900 games included. However, some games were featured in premium slots called “Featured Demos.” Valve picked 10 developers that they found interesting and did a special QA video.
You can still browse the festival page here.
You can also watch the featured interviews here.
I was curious how well a festival like this does in giving visibility to a game so I reached out to as many indies as I could and asked them to share their data with me via a survey. The survey form is still up. If you participated in the festival and would like to contribute, click here.
I also wanted to help developers understand how their game measured up. Unless you have been doing this for a while you might look at a 1% impression-to-page-view conversion rate and think your capsule is terrible. In actuality that is pretty good. Knowing this data will help you gauge what you should be doing with your marketing.
This report features data from 56 different games. Some developers asked that I not share the name of their game and their specific stats. For those games they will appear in aggregate charts but not in shortlists. If you see a list of games and one of the names is “redacted”, that is why.
I also decided to list and link to games that performed really well. I think it is important for you to look at pages and games that perform well so you can get a sense of the genre and information that Steam users are looking for.
I didn’t link to the games that were the lowest performers. I didn’t want to make the developers feel discouraged. Making games is hard enough and I didn’t know if these games were just hobbies that people were doing for the love of it.
So how many wishlists did your game get if it was in the festival?
Outside of actual purchases, “wishlists” are the best indicator of a buyer’s intent. Enterprising developers can even forecast sales based on the number of wishlists. You can read about some of the great research that Jake Birkett has done on that subject here and here.
So how many wishilsts did a typical game get during the week of the Steam Summer Festival?
Stats earned during the festival
- Average number of wishlists: 3218
- Median number of wishlists: 500
- Most wishlists earned by a single game: 41096 (The Riftbreaker)
- Fewest wishlists earned by a single game: 40
How did the number of wishlists earned during the festival compare to a normal non-promotional week? In my survey, I asked people to look at a 7-day period where their game was not featured, and they were not running any major promotions to it.
Here are the results:
- Average wishlist increase during the festival vs a typical week: 3200%
- Median wishlist increase during the festival vs a typical week: 1540%
- The highest single increase by a game: 34200% (Papetura)
- The lowest-performing game only saw a 200%
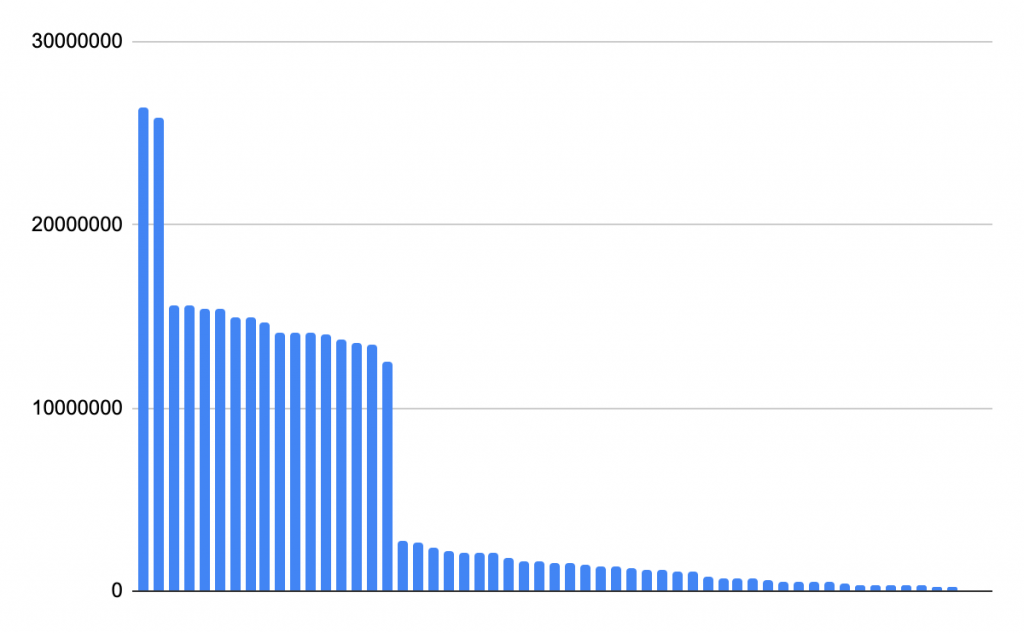
I graphed all 56 games and how many wishlists they earned. Each blue bar represents a different game. As you can see the distribution like many things on Steam features a couple of breakaway favorites with a very long tail.

What were the most popular games?
The top 5 games by wishlist earned during the festival.
- The Riftbreaker (41,096 wishlists)
- [Game redacted]
- Backbone (15460 wishlists)
- Hundred Days – Wine Making Simulator (9217 wishlists)
- The Last Spell (8650 wishlists)
Let’s look at the funnel
If you read my stuff, you know one of the most important marketing concepts is the funnel. Basically in any marketing system, a bunch of potential customers are going to start on the marketing journey you created but only a few are going to stick with you when it comes time to press that wishlist button. That is just marketing life and you have to get used to it. In the context of the Steam festival, the funnel looks like this:
- Impression – Seeing your capsule somewhere
- Hovering over the capsule
- Clicking the capsules
- Viewing the Steam page
- Clicking the wishlist button
At each step you are going to have people that click away instead of going to the next number down. Let’s dive down the funnel and look at how games did
Impressions during the festival
Impressions are defined by Valve as “Number of times a clickable store capsule image has been shown to users.” Basically, every time the game’s capsule appears on a user’s screen it counts as an impression (even if it was shown for a nanosecond while they were was scrolling by it at 100 miles per hour).
Not all games got equal treatment at the festival. There were special sections on each page like “Featured demos” which valve specifically selected. The criteria for this selection was not released by Valve.
There was also a section called “from your wishlist.”
Here are all the games graphed by impression. Note that the games are arranged from most impressions to fewest. Some games changed places in the ranking compared to the previous chart on the total number of wishlists.
See those notches. You can see how algorithmic Valve is with its exposure numbers. Sure the top 2 games were outliers but there is this whole middle tier that got the “featured demo” treatment.
So what games got their capsules shown the most?
- The Riftbreaker (26,410,000 impressions)
- [Game redacted]
- Ostranauts (15,600,000 impressions)
- Snowtopia Ski Resort Tycoon (15,460,000 impressions)
- Hundred Days – Winemaking Simulator (15,380,000 impressions)
Why were those two games so far ahead of the others? My hunch is that they also had a LOT of wishlists before the festival and they got featured. So those games appeared twice on everyones page: first for featured, and second for “from your wishlist.”
I thought it would also be interesting to look at some of the games that were on the wrong side of the “no feature cliff” but still did pretty well with the views.
The #1 game from traffic but was not featured was a game was Snowballer with 2,614,332 views. It looks like a really fun game actually. Compare this with the success of Snowtopia… could there be a latent interest in snow games?
Click through percentage
If a user thinks a capsule looks interesting they usually hover their mouse over the capsule, look at the top 4 screenshots, tags, short description. This is “the hover.” For more information about how this behavior works, look at my talk on Steam and my article about it here.
If users thought the game was interesting after the hover, they clicked the capsule and went to the game’s store page.
The ratio between the number of times the capsule was shown to the number of people who clicked the capsule is the “click-through percentage.” If you are new to games marketing you might be shocked that this number is VERY VERY low. The top-performing game in the steam festival had a click-through rate of 3.95%. That was the top. Consider these aggregated numbers:
- The average click-through percentage is 0.61%
- The median click-through percentage is 0.35%
No I didn’t forget to move the decimal 2 places to the right. It really is less than 1% of people will click your capsule.
Here is a graph of all the games and their click-through rate. The Y-axis is %.
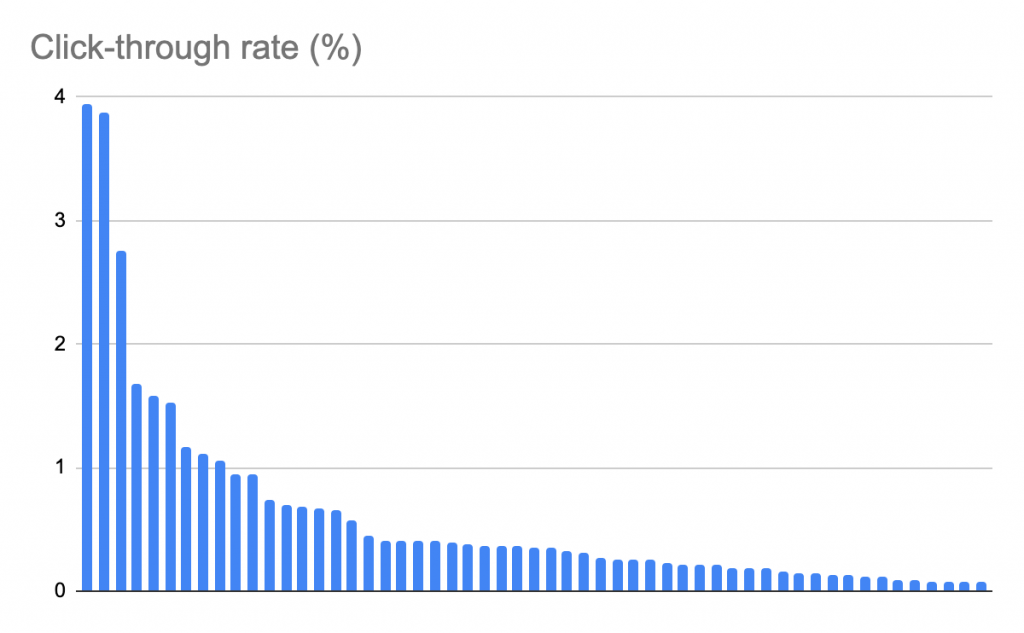
So what were the top 5 games by click percentage?
- Making it Home (3.95% click-through)
- As Far as The Eye (3.87% click-through)
- [Redacted game]
- Do Not Buy this Game (1.68% click-through)
- [Redacted game]
Now compare this list to some of the lowest click-through percentages.
- Bot Gaiden (0.07% click-through)
- Clan O’Conall and the Crown of the Stag (0.08% click-through)
Now you might notice that games with the highest click-through percentage weren’t the ones that got the most wishilsts. That’s because the biggest games got a lot of featuring which means their capsules were shown at the top of nearly every page. They were shown over and over and over again to users browsing the store.
Notice that Bot Gaiden got the second-worst click-through percentages but was the top 18 game by wishlists. It also got the top 10 games based on impressions. But because it was featured heavily by Valve and got an interview. With a 0.07% click-through rate you might be saying “Time to change the capsule dude!”
Don’t change it yet! I have a theory on that game in the section about wishlists percentages.
Note also that all 5 of the games with the highest click-through percentage were NOT featured on the festival page. I like to think of these games as the ones with the best first impression that were not featured by Valve. They all have great organic reach. They seem to have very well optimized capsules, descriptions, hooks, and tags. They are making the most of their given situation. Study what these games did because they beat the odds.
Store page visits
After a user clicks the capsule image they arrive on a game’s store page and this counts as a store page visit. Valve officially defines this metric as “Unique page loads for your product’s store page.”
Note that if a game was linked to directly by an external source like a tweet, a newsletter, or a streamer, this number would increment without incrementing the number of “impressions.”

Here are some general stats:
- Average page views: 22251
- Median page views: 4748
- Fewest page views: 1244
Top 5 Games here were:
- [Redacted game]
- The Riftbreaker (278523 page views)
- Backbone (63680 page views)
- Ostranauts (57529 page views)
- [Redacted game]
Store page to wishlist conversions
So here we are at the bottom of the funnel. How many people after viewing the capsule, then clicking it, then scrolling down to the “wishlist” button, actually clicked it?
Since I know the number of wishlists for every game, and the number of page views, I can calculate what percentage of people looked at each game page and said “ooh this is neat, wishilst!”
I like looking at the pages that rank at the top here because you could almost consider these games as the best Steam pages. They were the ones most likely to convince browsers to wishlists their game. This statistic is egalitarian. It is the stat that is not influenced by how much exposure Steam gave your game. Really it is all down to your trailer, screenshots, and copywriting.
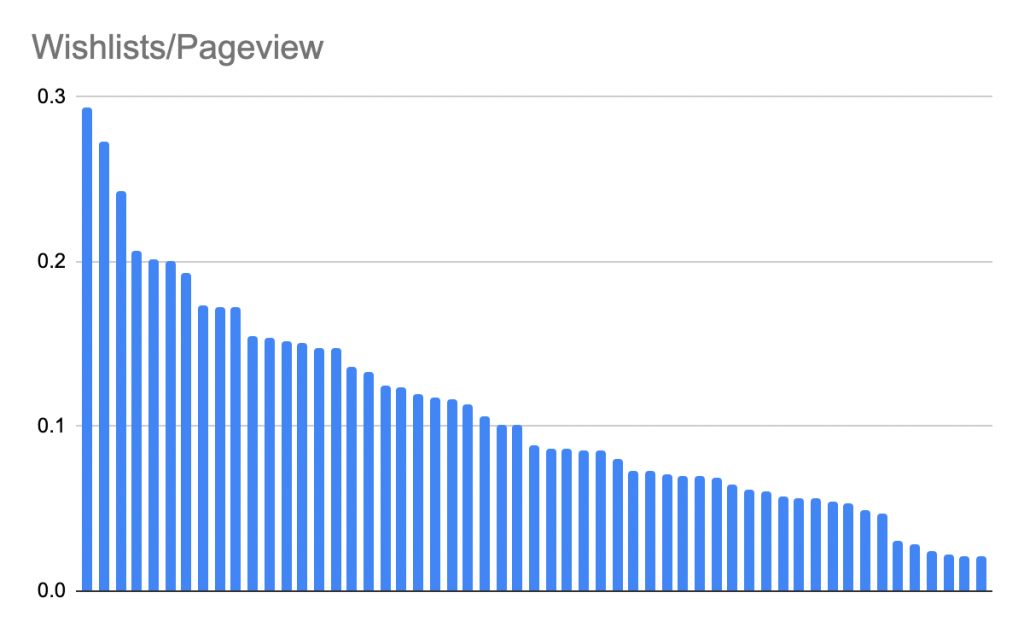
Look at how smooth that wedge is. There is no precipitous hockey-stick shape to this chart. It shows a pretty even distribution of page quality vs the jagged charts that indicate Steam page favoring.
- Average page view to wishlist ratio: 10.8%
- Median page view to wishlist ratio: 8.9%
- Lowest wishlist ratio: 2.1%
Lets look at the games with the top wishlist conversion rates. These are the games to study if you want a good Steam page.
- Papetura (29.4% conversion)
- Do Not Buy This Game (27.3% conversion)
- Backbone (24.2% conversion)
- She Dreams Elsewhere (20.6%)
- [Game Redacted]
- Bot Gaiden (20%)
Side note: Look at Bot Gaiden there on the list. Remember it was the game with the lowest click-through rate from impressions to page views. But here it has the top page view to wishlists. Sound counterintuitive?
Not at all!
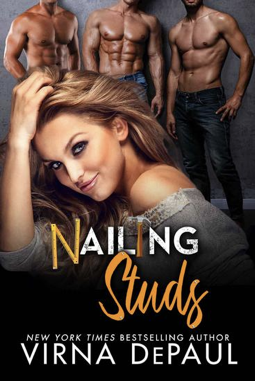
This means the Bot Gaiden capsule does a great job explaining at a glance what type of game it is. It instantly filters out people who just aren’t that into platformers that look like Mega Man. They just have a niche genre. Their store page does a great job saying “this is a Mega-man-like game.” The developers of this game know this sub-sub-sub genre’s tropes, the kinks of its audience, and it puts them right out there. This game is a perfect example of the Romance Book Covers I talked about in my GDC Talk Empathizing with Steam.
Did Steam Curation Help?
One interesting thing about this Summer Festival is that Valve did some curation. Valve did specific interviews with 10 games that they thought interesting. 5 of the developers in the featured 10 shared data with me. How did those numbers turn out?
Here are the number of page views with the games featured in the Steam Festival highlighted in red. Note that I excluded the top 2 games from this chart because those games were not interviewed by Valve and they had so many page views that they were throwing off the scale for all the other games.
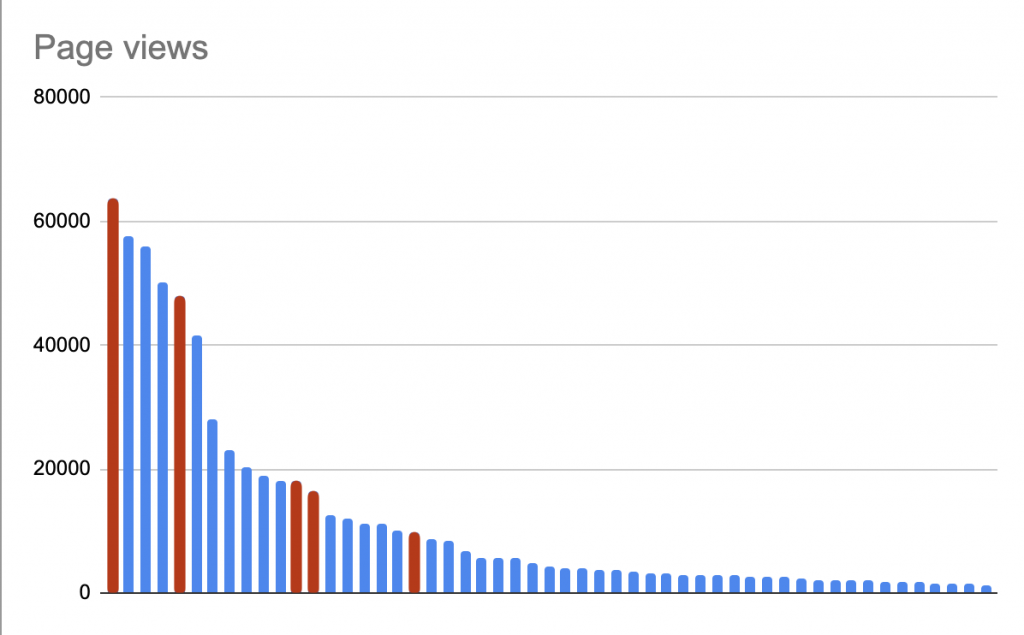
As you can see that Youtube featuring and interviewing by valve did not translate directly to being the most popular games.
Often frustrated game developers tweet out “All these game discoverability issues would go away if Steam just had curation!” The thing I take away from this chart is that nobody knows what games are going to be popular with the market. Curation is not going to fix everything on Steam. Nobody knows what the audience wants except the audience.
Did Streaming and doing the QAs help?
As part of the festival, Valved allowed developers to schedule time slots where they could stream their game and link to a Discord where they would hold AMAs with the audience.
According to my data:
- The average game that did a stream got 3875 Wishlists
- The average game that did not stream got 1971 Wishlists.
games that were streamed by their developers gained 50.8% more wishlists during the festival than those that didn’t.
Now I understand that higher quality and more popular games also had bigger teams so they probably had more time to stream. A one-person-team doing this on nights and weekends probably can’t do something like a live Q&A. They probably had a day job.
What Genre got the most wishlists?
There are a lot of tags and sub genres on Steam. But before the festival Valve asked all developers to update their tags. Then Valve went in and did some magic to assign each festival game to 11 different genres. Most games were assigned to 2-3 genres but some were assigned 1.
The main festival represented these 11 genres as navigation. Clicking one of those opened a page composed entirely of festival games matching that genre.

The official festival genres were: Action, Adventure, Strategy, Simulation, RPG, Puzzle, Platformer, Sports & Racing, Horror, Visual Novel, VR. I went back and cross-referenced the games with their genres and averaged wishlists across all the games in that navigation genre.
So which Navigation Genre was the most popular?
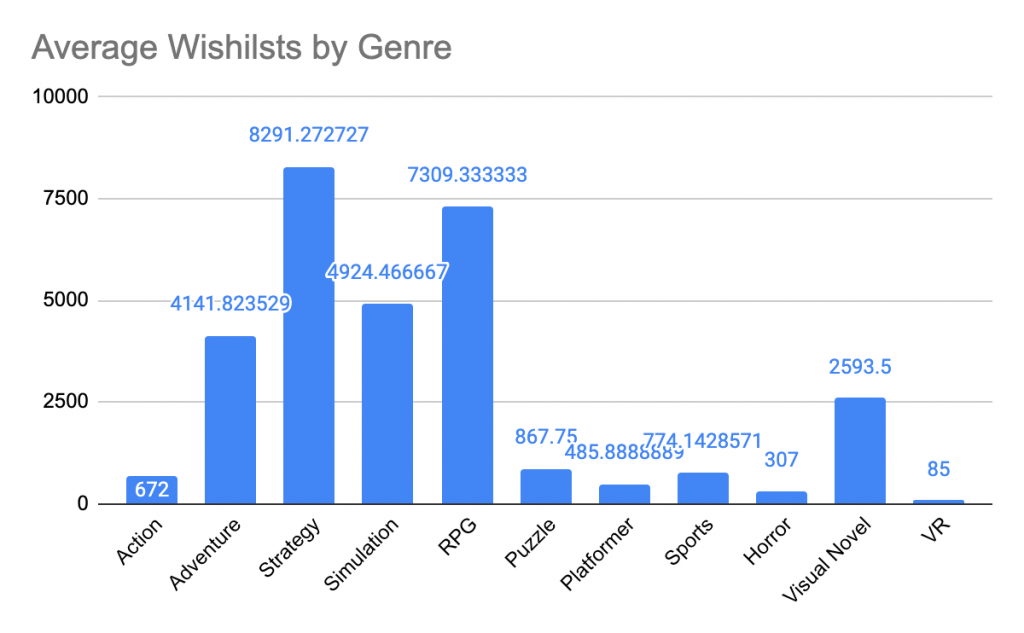
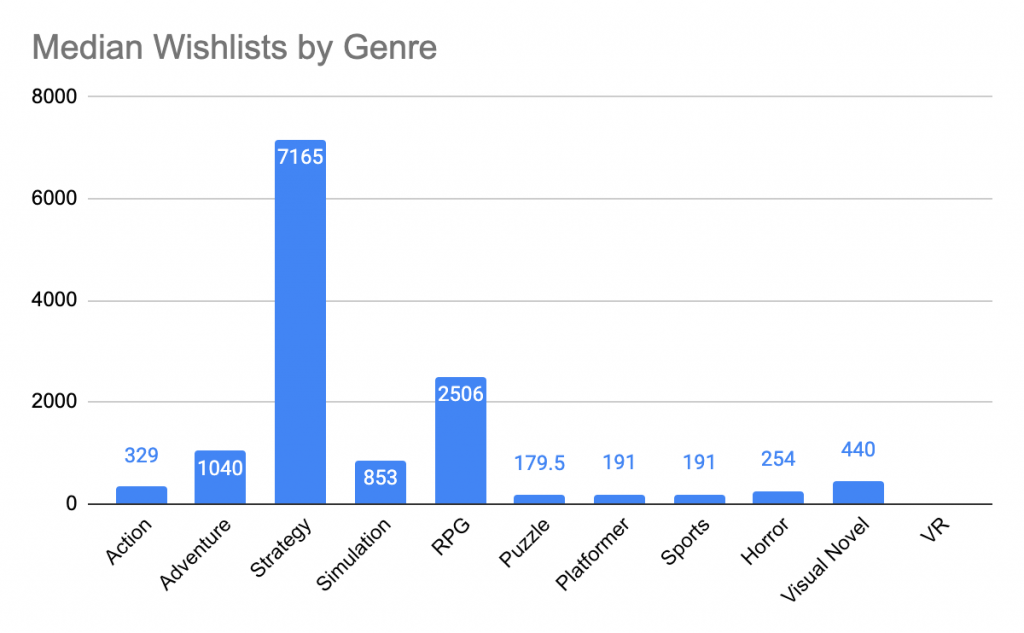
Strategy by far. Followed by RPG, Simulation, Adventure, and Action. Note that some games appeared in multiple categories like Action and RPG. I basically evaluated every tag individually.
If you have been studying the Steam sales charts for some time this genre chart shouldn’t be much of a surprise. But if you are looking at this chart and considering making a puzzle platformer, please watch this talk.
Final thoughts
I mentioned that I didn’t link to poorly performing games out of fairness to the developers. I did look at a bunch of those underperforming games and there were 2 major reasons why those games underperformed in my opinion.
- The genre. If you look at the previous section, you can clearly see that the steam shopper prefers a certain type of game. If you are making a puzzle game or a platformer game (or worst yet, a puzzle platformer) you have to really really outperform to get above that.
- The art – I could almost predict the click-through rate of a game based on the capsule image and screenshots. Those two pieces of games media are so so important in establishing interest in your game. If you have any budget I would spend it on a really good artist. If you can’t hire one to do the entire game, at least hire one to make your capsule art. It really takes a special talent to make capsule art. Unless you are a professional illustrator, I would recommend AGAINST doing your own capsule art (Even if you are a pretty good graphic designer). The bar is just too high for quality.
We all had fun in the end
One final question I asked in my survey was “Did yo think it was worth it.
78% of respondents said they thought it was worth it to make a demo and put their game on the steam festival.
Based on the data I saw, building your game and uploading it to Steam for a festival is so much more productive than building a booth, shipping it to some conference center half way around the world, flying out, staying in a hotel, getting sick, getting tired, and not developing your game.
I hope this experiment with online-festivals shows developers how much more efficient it is to present your game digitally.
Before I go, I want to thank everyone who submitted their data and allowed me to share it. The kindness and openness of the indie community is a truly inspirational thing. We are all working together to help each other out.
Thanks.