Wonder what is normal? Want to know what to expect with your launch? I have created a top to bottom timeline of major milestones and what metrics you can expect to see at each.
The benchmarks in this timeline are divided into 4 tiers of gross lifetime income. For more information about how to use this chart and understand the earning tiers, read this post.
Gross earning tiers
🥉 Bronze: $0 – $10,000
🥈 Silver: $10,001 – $249K
🥇 Gold: $250K – $999K
💎 Diamond: $1 Million+
Coming Soon Page Launch
How many wishlists will I earn when I launch my Steam page?
🥉 100 wishlists
🥈 500 wishlists
🥇 1200 wishlists
💎 7000 wishlists
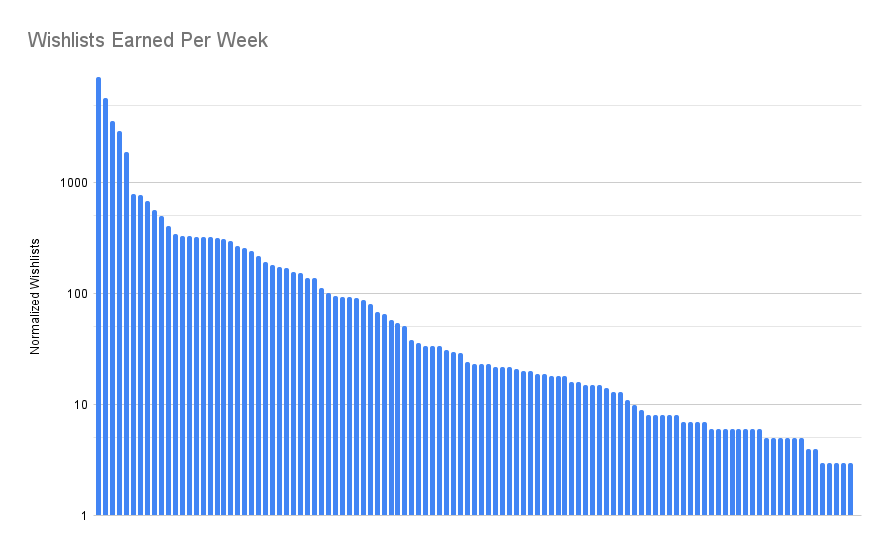
Research
How many wishlists do you earn when you launch your steam page?
(Study date: August 2022)