Hey everyone, my name’s Lars Doucet, I’m a friend of Chris, and he asked me to write a guest post today. I’m the developer of a brand new data analysis site called www.gamedatacrunch.com, and today I’ll be sharing some tips with you about how you can use data analysis to help you make business and marketing decisions — and the pitfalls you should avoid.
I’ll start with a practical tip drawn from another website before I start tooting my own horn too much:
1. Case study: Data-informed discounts
A lot of amateur data analysts think that if they look at a giant pile of data they’ll magically come up with great insights. There’s two dangers to this approach: you’ll easily over-react to meaningless patterns, or just as likely, you’ll just waste a bunch of time.
It often helps to wait until you have a concrete question. Then think to yourself, “what data could answer this?” Then ask: “where can I find that data? Is it even available? And if it is, is it reliable?”
Here’s an example:
“I’m about to put my game on discount. What discount should I pick?”
The conventional wisdom is pretty solid: if you’ve never discounted before, you should start with a modest discount, slowly stair-stepping your discounts up each time you go on sale. But that’s broad advice — if you’re trying to narrow things down between, say, 10% and 15%, how do you choose?
Well, IsThereAnyDeal.com has a really useful tool for that in beta right now. Go to their beta site at new.isthereanydeal.com, look up a game, then click “Stats”. Here’s their page for the hit crafting game Forager:
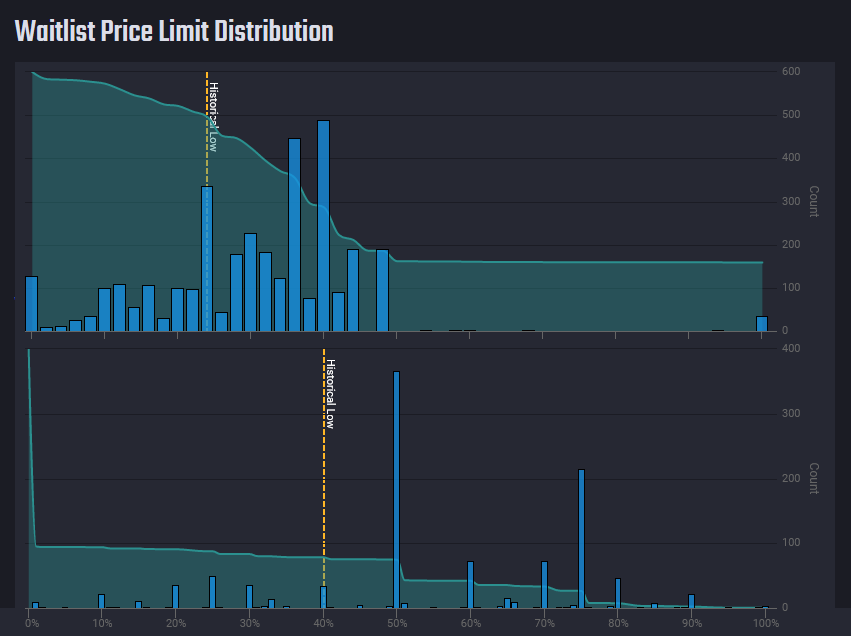
Compulsive discount-watchers use this website to set a personal price waitlist for various games, and when the game reaches or exceeds their preferred discount they get an email alert. And IsThereAnyDeal aggregates all these waitlists and thresholds into handy charts. The really interesting bit is the bottom chart there. See that big spike right at 50%?
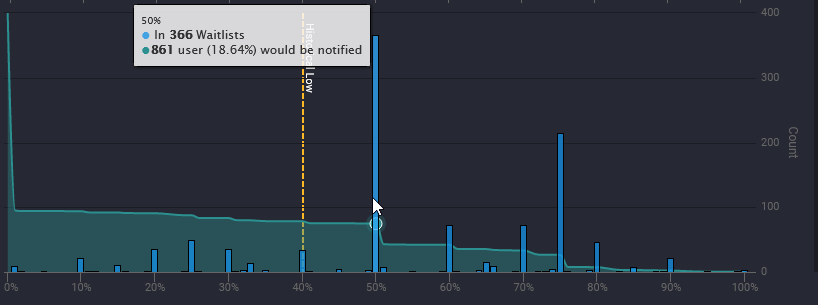
861 users will be notified when this game hits 50% off. This figure only tracks users on IsthereAnyDeal’s private waitlist system, so it’s a skewed population that’s not a perfect representation of Steam’s general population. But it’s a better signal than nothing, and if I was the developer of Forager and I was considering whether to do 50% or 60% off for my next discount, I’d pick 50%.
Incidentally, the next single biggest spike after 50% is 75%. I would bet an analysis would show that most people waiting for a deal are waiting around for the 25%, 50%, and 75% marks, so if your planned discounts are close to any of those markers already, it might be best to try to target them directly so that you don’t either overshoot your discount (and short-change yourself), or undershoot (and miss a large audience lined up to buy).
This is the kind of data that drives an actual concrete business decision. However, I’ve seen plenty of amateur analysts encounter treasure troves of data like this and completely miss awesome insights because they’re too busy looking in the wrong places, or even worse — asking the wrong questions.
2. Relative Rankings are more important than absolute sales
SteamDB has a pretty neat feature where it aggregates sales estimations from various sources and puts them in one place.
Let’s see how accurate the existing methods are. The recent hit game Fall Guys hit 7 million units (owners) on Steam according to its publisher on August 26:
On August 27th, according to this tweet thread, these were the current estimates:
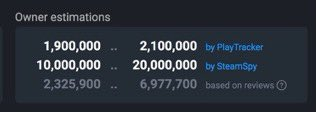
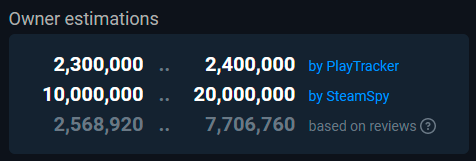
And here’s where they’re at right now:
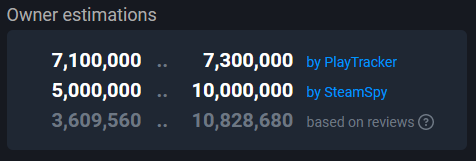
I’m pretty familiar with the methods being used here. The “based on reviews” estimate is just the Boxleiter method — multiply number of reviews on the store page by some constant between 20 and 60. Playtracker.net is run by an acquaintance of mine who crawls all publicly available steam profiles to count up owners as the basis for his “insight” owner count estimates, which is supplemented by ground truth data whenever a publisher brags about how many copies they really sold. I’m not sure what SteamSpy is doing these days ever since Valve changed their user profile default privacy settings, but I figure it’s probably something similar.
There’s a ton of arguing in this space about who’s method is the most accurate, but with all due respect to everyone else’s method (and I mean that sincerely) I think we should move beyond estimating sales numbers.
Why grasp after unknown imprecise guesses when we can directly measure known, precise facts for each and every game on Steam, and then just rank them relative to one another?
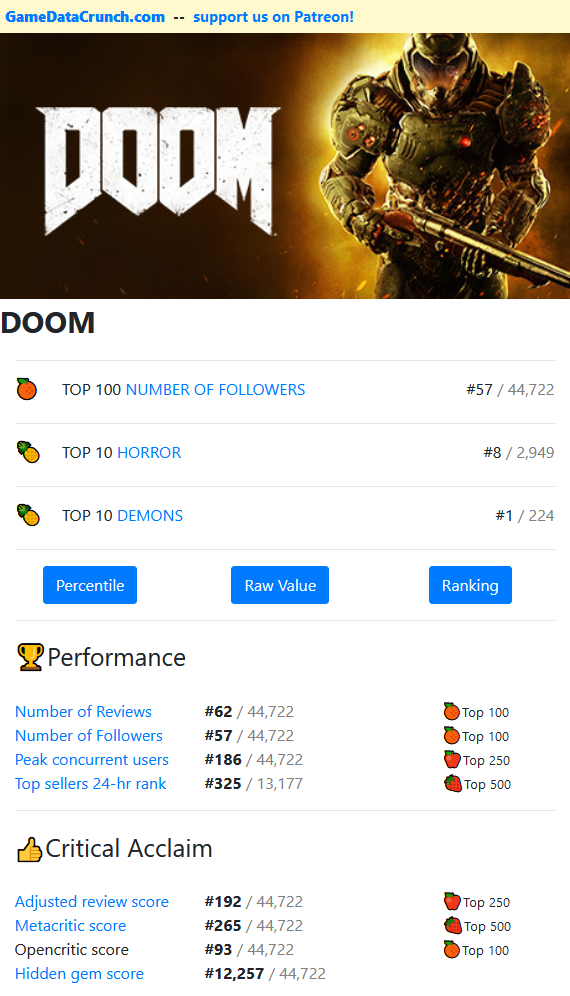
I don’t know how many copies Doom (2016) has sold, and neither do you. But I do know how many reviews it has, and I know how many reviews every other game on Steam has as well. I also know how many people have clicked the “follow this game” button because I can count how many people belong to the Doom (2016) game hub on Steam (which is what “follow this game” adds you to). Likewise, thanks to SteamCharts.com I can measure the maximum number of people who were ever simultaneously playing the game, and I can measure its position in the top sellers chart over the last 24 hours.
Each of these figures is biased and limited in its own ways. The top seller chart is really useful, but only covers a short window of time. Number of reviews underestimates performance for old games launched before the review system existed, and overestimates recent performance because Steam made a tweak in the last year that encourages players to review games more often. Peak concurrent users is biased towards multiplayer games, and followers is biased towards games that drive on-site community engagement (underestimaing popular games with quiet communities, or simply ones that organize primarily outside of Steam). But all these metrics taken together, and displayed as relative ranks rather than absolute figures multiplied by magic numbers, starts to paint a picture.
I think it’s safe to say that however much Doom 2016 has actually sold, it probably sits among the top 250 games on Steam.
Now, one should never take data like this out of context, which is why I have the beginnings of a handy context panel:
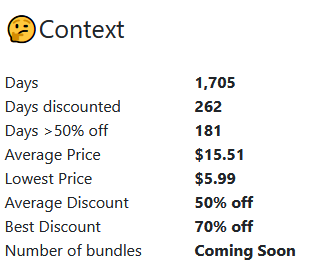
This game’s been out for a long time, and it’s been discounted several times, as much as 70% off. So probably most of the copies of this game were sold at a pretty big discount. (That “Average Price” is the average price on any given day for its total existence, not average selling price, which is unknown — but almost certainly lower). Also, if this game was in a lot of bundles that might be inflating some of it’s performance stats (I’ll be populating this figure in the context panel soon, thanks to IsThereAnyDeal).
But let’s dig a bit deeper. How well did Doom do within its genres?
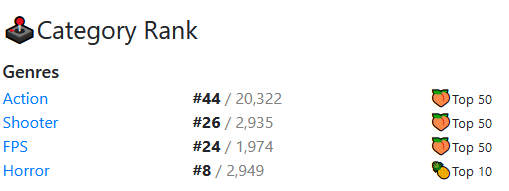
Pretty well! (This view takes the performance rank and then filters rank by the given tag).
Action is a huge category that’s basically half the Steam catalog, so hitting spot #44 is no mean feat. Horror is an niche, but a fairly big one, so getting to #8 is impressive.
I wonder what are the 7 Horror games that had better performance stats than Doom? Let’s find out.
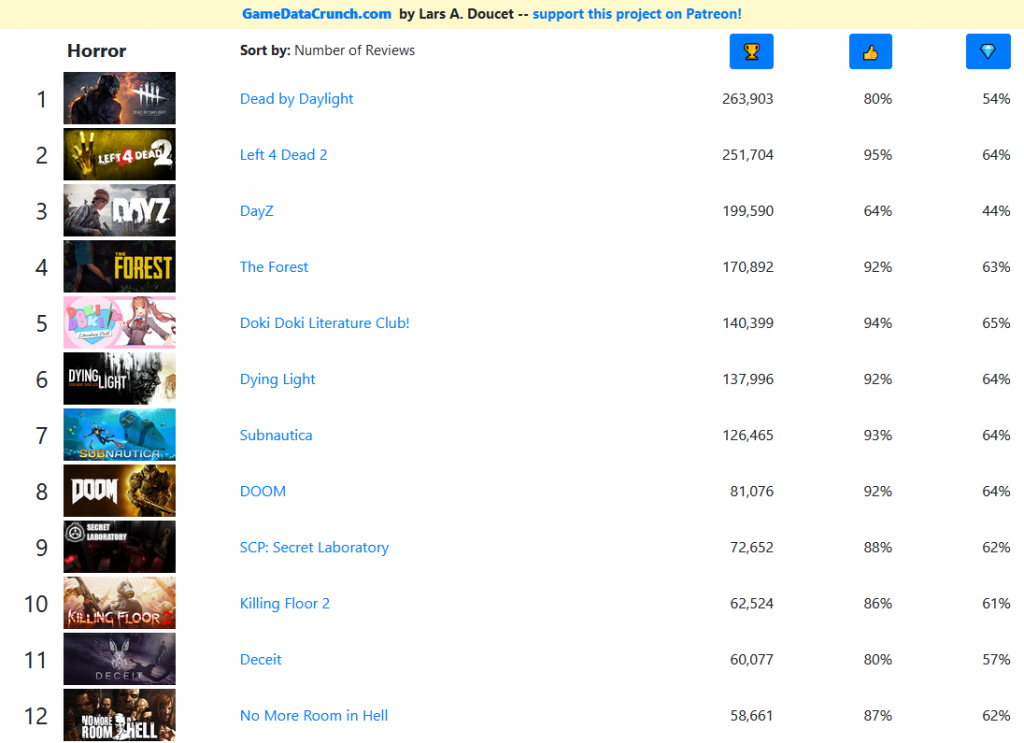
This says a lot about how many units Doki Doki Literature Club and Subnautica must have moved for them to edge out Doom 2016. Though to be fair, DDLC was a free game (a contextual point I will be highlighting soon)
3. Data should tell a story (honestly)
This comic (whose author I sadly can’t track down) perfectly illustrates my philosophy of data analysis:
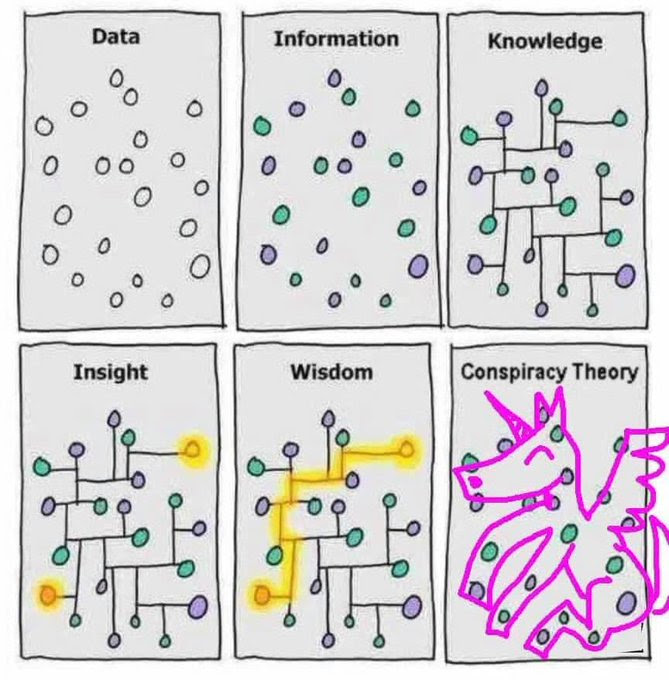
Data by itself is just a useless soup of dots.Information labels and organizes your dots.
Knowledge ties all the dots together.
Insight identifies the relevant dots.Wisdom is connecting those relevant dots.
Conspiracy Theorizing blows past all of that and just pulls patterns out of thin air.
With GameDataCrunch I don’t want to just dump a bucket of spurious facts over the user’s head, or go overboard into speculation and astrology.
I want to tell stories with data, but accurate stories that are also useful.
Here’s a few.
“Steam’s Greatest Hidden Gem”
Check out Lair of the Clockwork God:
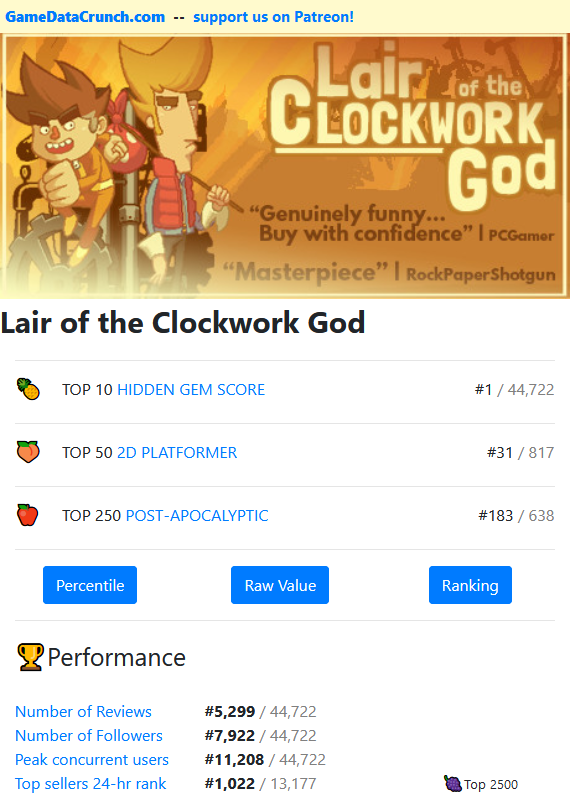
This game had middling performance stats, but good reviews. In fact, it had really good reviews relative to its performance — making it the #1 “Hidden Gem” on all of Steam.
This is a pretty easy pattern to detect — a game with really good review scores that didn’t set the world on fire in terms of performance.
Here’s another story:
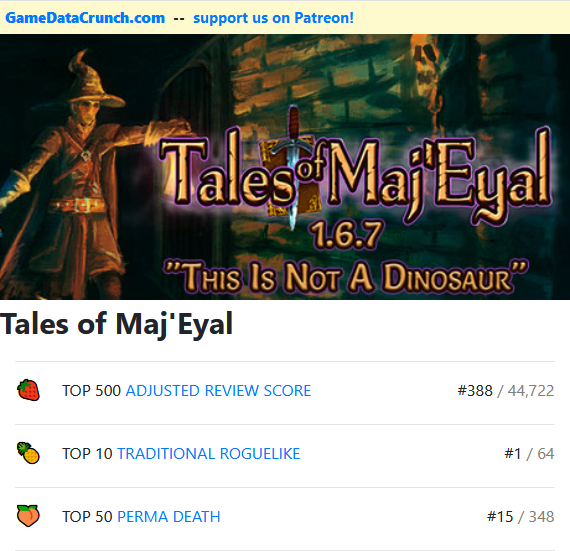
This is the #1 Traditional Roguelike on all of Steam. It is literally a Genre king. (Well, maybe a sub-genre king…)
How did it perform?
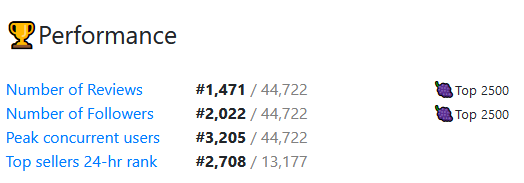
Not bad! Hovering around the top 2500 or so. That’s a very respectable showing, and way better than the average indie game ever achieves. But consider… this is the very top of the “Traditional Roguelike” sub-genre. What’s the top of the “Action Roguelike” sub-genre?
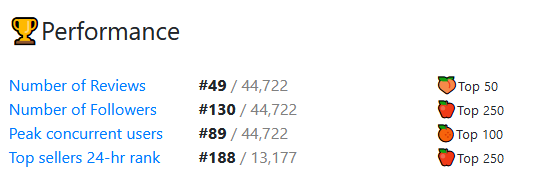
The smash hit Binding of Isaac, naturally:

Just look at those performance stats:
The schism of the ancient “Roguelike” genre into “Traditional Roguelike” and “Action Roguelike” variants is a fascinating one, with the traditionalists sticking to the old definition of “Directly inspired by this particular game called Rogue and hewing fairly close to certain hallmarks of that design” versus the more modern definition: “Has permadeath and procedural generation and stuff.”
So what does this mean? Should you make an Action Roguelike instead of a Traditional Roguelike?
I don’t think you should use tools like this to mindlessly chase trends, but I do think you should use it to inform yourself and open your eyes. To wit, if you’re making an Action Roguelike you’re going up against some seriously world-class competition selling literally millions of copies, in a crowded and intensely competitive field.
Traditional Roguelikes on the other hand are a much smaller pond – which means less competition! But, do you have what it takes to lift the ceiling? In order to do bust out of the top 2500 you’ll have to unseat the reigning genre king. And maybe you can — but you’d better have a plan.
Keep your eyes and your ears open
Data can be enlightening, but only if you ask the right questions. And a big part of that is paying attention to what questions other people are asking. As I build this site, I’m doing my level best to talk to every developer,
Publisher, PR agency, and marketeer to find out what questions I should ask and what views I should create. I want to make sure I’m helping people solve real problems, not just cataloging a bunch of data for its own sake.
So if you find this site useful at all, be sure to let me know 🙂 You can reach me at lars.doucet@gmail.com and @larsiusprime on twitter.
Much thanks to Chris for letting me guest post, and I hope this resource is helpful to all of you in your efforts!
Cheers,Lars Doucet