NOTE: This article has been updated. This one is still important to read, but you can find even more details and more information in the 2022 version of this study: What Genres Are Popular on Steam in 2022.
One of the findings from the Summer Festival (which I wrote up here) is how much Steam prefers one genre over the other. This is how many wishlists each genre got during the Steam Summer Festival
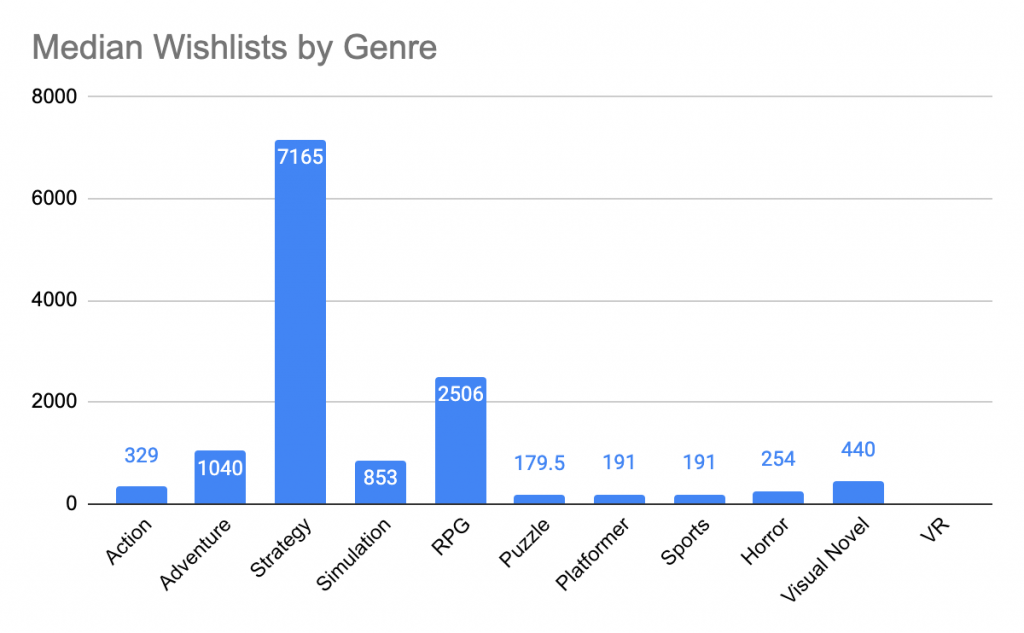
There are clear winners here.
I went back into the legendary article Danny Weinbaum wrote in which he compiled all Steam games into a single spreadsheet with estimations of total earnings. I wanted to see how actual sales compared to the wishlist data that I got from the festival. I was curious, do the actual sales match up to the wishlist preference that Steam users were showing?
But before we get to that a quick peptalk about why should look at this data when making games.
Quick data pep-talk
A lot of indies got into making games because they are passionate about making games (I know I did). You might be saying “but man! Trying to read these tea leaves are honking-my-buzz. You can’t predict feelings or the soul of a game or true love. Just make what you are passionate about, pour your heart into it, and everything will work out fine. Why are you trying to do design by committee man!?! You might as well work for EA and make another Madden?”
I get it! Truly I do. In fact, I made several 2D platformers because I love the genre! It is what made me fall in love with video games. But they are very hard to sell.
When we study the market like this, we do it not to market test every creative decision, we do it to have some preview of what is coming. I have so many game ideas rolling around in my head – many more than I can ever actually develop. I am equally passionate about each one. So if I have to pick one, why not try and see which one has the best shot at sustainably supporting me and my family?
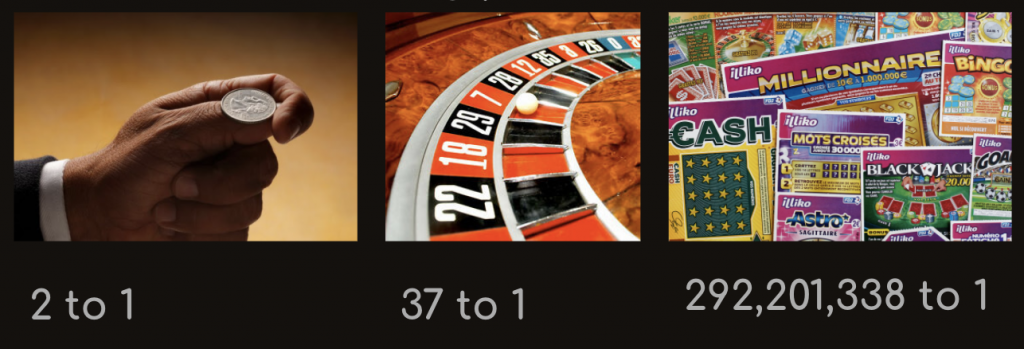
Looking at what is selling in the market place is not about turning your creative decisions over to market testing. Really, it is about assessing risk. You just want to know if dedicating 6 months to 2 years on a project a good bet or a very very risky bet? Am I flipping a coin or playing the lottery?
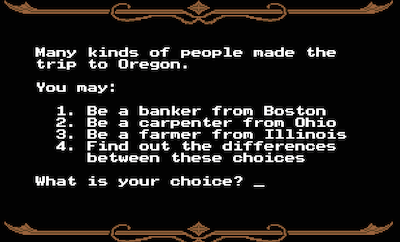
I am not saying you should never ever make a 2D platformer game. I just want you to have all the information before you set out. It is like at the start of The Oregon Trail game when you could pick your occupation. It told you right there the stat bonuses and disadvantages you had before the journey. Think of this blog post as that warning before you embark on your journey.
I also find knowing this information soothing. Releasing a game that didn’t earn what you hoped it would can be very hard to take and you might take it personally. Am I a bad designer? But if you know the market conditions better you can help your confidence by saying “we made a small bet on a very risky genre. It failed but we realize that we actually earned within the market expectations.”
Ok so I hope you look at this data to give you more confidence, not to make you think you have to turn all your creative decisions over to market research.
What Steam users are buying
When you are releasing a game you always have high hopes. What if this game goes big and becomes a hit!?! But also what happens if it is just an average release. Or what if it fails? What will that look like? To find this I calculated what the median sales of each genre look like (aka a moderate success). Then I calculated the 30 percentile for each genre (aka a disappointing release.) Then I went in and looked at what a “hit” looks like – which I define as doing better than 70% of the games in your genre.
Here is what happens if I graph all those genres and what the 30%-50%-70% earning look like.
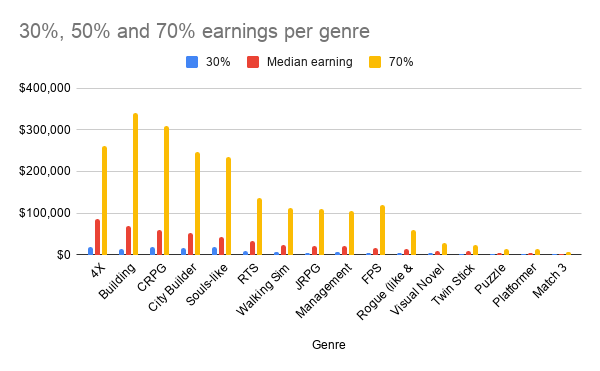
As you can see, the earning potential of each genre mirrors the wishlist behavior during the Summer festival. In short: Strategy and RPG games make a lot of money.
In the Steam festival wishlist data, Steam only breaks out the genres as “Strategy” and “Action.” I went deeper into the sub-genres of Strategy like 4X, Building, City Builders, and RTS. As you can see all of those sub-genres are very popular with the Steam audience.
In the 30%-50%-70% chart, you can also see the very slim tail of Puzzle, Platformer, and Visual Novels. I even broke out a category for Rogue-lite/Rogue-like. Even though every game seems to be a -rogue these days, that isn’t true when it comes to sales.
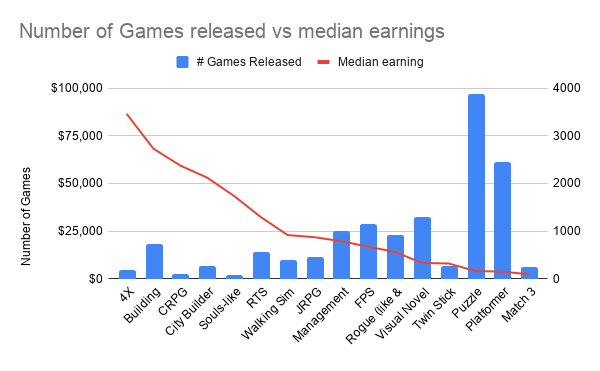
I then was thinking, well how many of each of those games are there? So I graphed the number of games released in each genre. Amazingly it looks like a mirror of the earning potential chart.
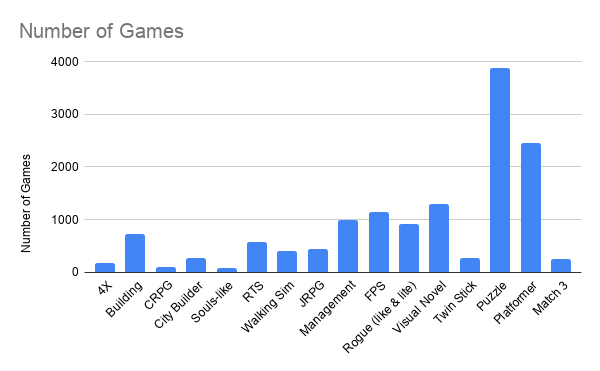
I was thinking, “what if you look at the number of games released and compare it to the median earning graph?” It would look like this:

Now that looks a bit familiar. Where have I seen that before???? Ah yes, a supply and demand chart:

Basically, it seems like we have an oversupply of platformers and puzzle games while also a lot of demand for Strategy and RPGs.
Here is the actual numbers for each of these genres and the estimated earnings at 30%-50%-70%. This chart is sorted by the median earning amount.
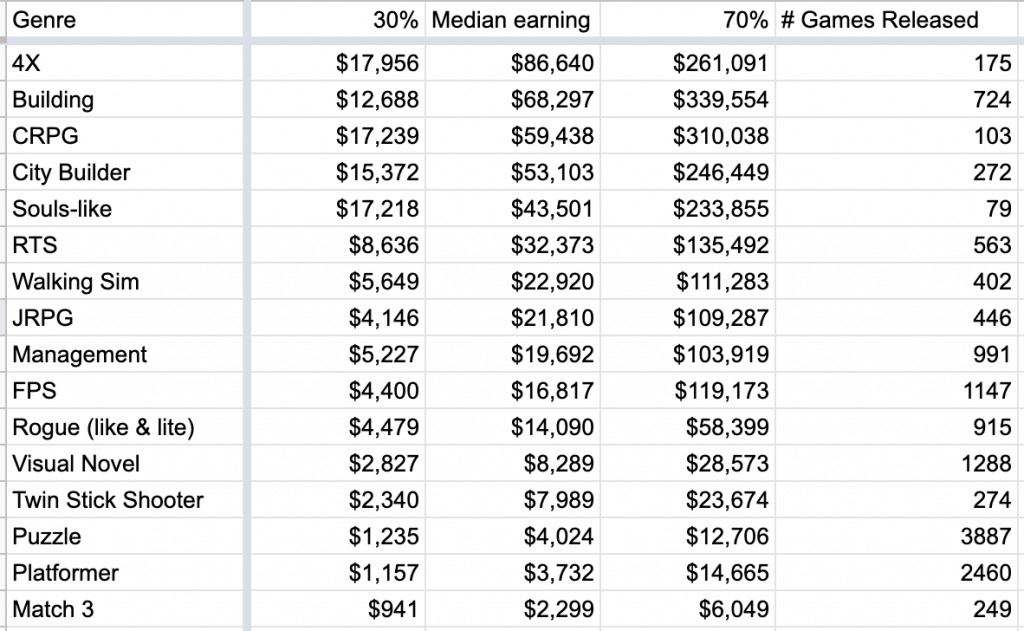
Good luck. I hope this gives you a high-level view of what is selling on Steam.