In October Steam hosted its second festival featuring unreleased games. You can still see the page here. I reached out to as many developers who appeared in the festival to see if they would share their numbers with me with the goal of understanding how the festival does in promoting your game.
I took a similar look at the Summer Festival you can see the results here.
For the Autumn Festival I got feedback from 40 developers (compared to data from 57 developers during the summer festival.) Note that in the charts below if I say “most popular game” I mean “most popular from the data that was given to me.” I didn’t get data from all of the games in the “featured games section.”
I am only releasing the game’s name if the developer consented to. If you see [redacted] that is because the developer only wanted to share their data in aggregate.
TLDR Findings
- This festival was less popular than the Summer festival.
- However, each game converted more of their traffic to wishlists than in the Summer festival.
- Getting the featured spot is super important you earn between 30,342 and 2085 wishlists (median = 7414.5) when you do.
- Getting featured on a sub-page is not great but better than nothing. You will get between 3349 and 25 wishlists (median = 378.5) when you do that.
- Getting picked to be a Featured game seems to be entirely based on Valve’s internal curation. Games that had a ton of wishlists before the festival were not picked to be featured while a game as low as 4476 wishlists was included in the featured spot.
- Steam shoppers really like Simulation, Strategy, RPG…. and this one erotica game.
- Even if you trick Steam into giving you TONS of exposure, it doesn’t automatically mean you will get TONS of wishlists if your game is not in a genre that most Steam shoppers like.
- These are good steam pages Marble Age: Remastered and Hostile Mars
- Schedule a stream for every day of the festival.
Detailed Findings with explanation
The Autumn Festival was less popular than the Summer one.
If I look at the average and median number of impressions, views, and wishlists for all the games I surveyed you can see how many more impressions the Summer Festival drove to games. This chart covers all games in my survey.
| Average (Summer) | Average (Autumn) | Median (Summer) | Median (Autumn) | ||
| Impressions | 5803742 | 1456211 | 1566579 | 276633 | |
| Views | 22251 | 22923 | 4748 | 2893 | |
| Click-through rate | 0.62% | 2.82% | 0.355% | 1.45% | |
| Wishlists | 3218 | 2674 | 500 | 342 |
If you look just at the top 5 games I surveyed in in the Summer Festival and Compare it to the top 5 games in the Autumn Festival you can similarly see the difference.
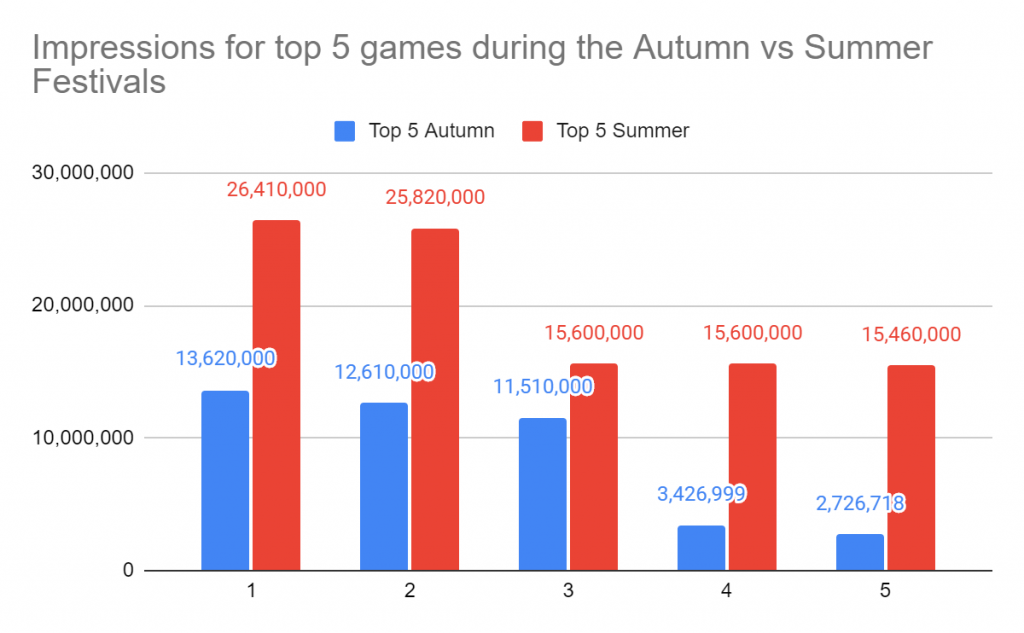
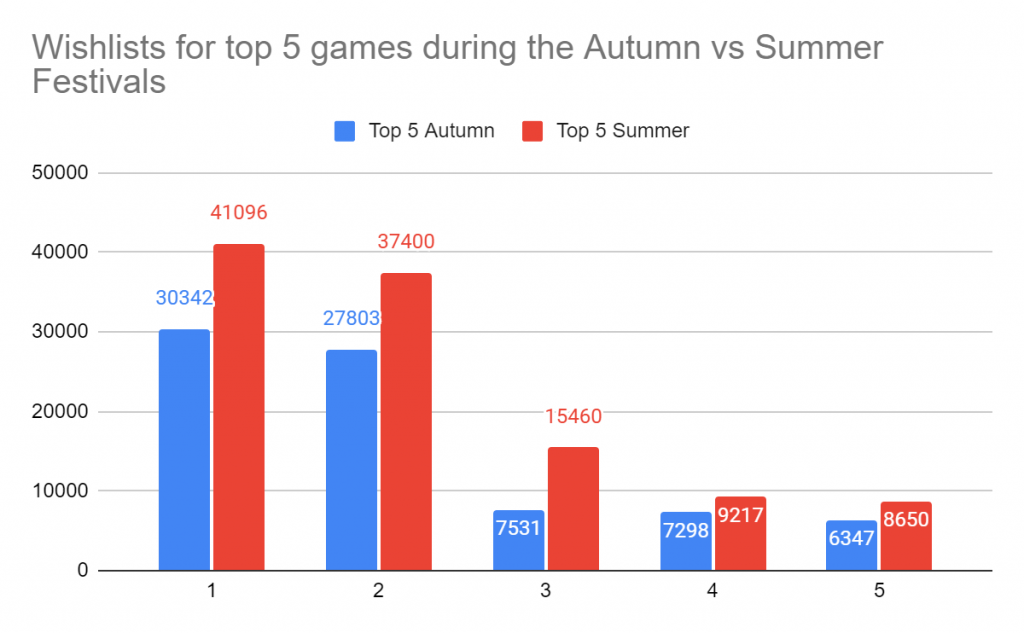
One thing you should note if you compare the two charts here of number of impressions vs number of wishlists.
Yes, the Autumn sale drove a lot less traffic, however, the number of wishlists gained were not as low as the number of impressions. This indicates that yes there was less traffic in the Autumn Festival, but the traffic that did appear was more interested in wishlisting games. You can also see this if you compare the click-through rate between Summer and Autumn. Much higher in Autumn.
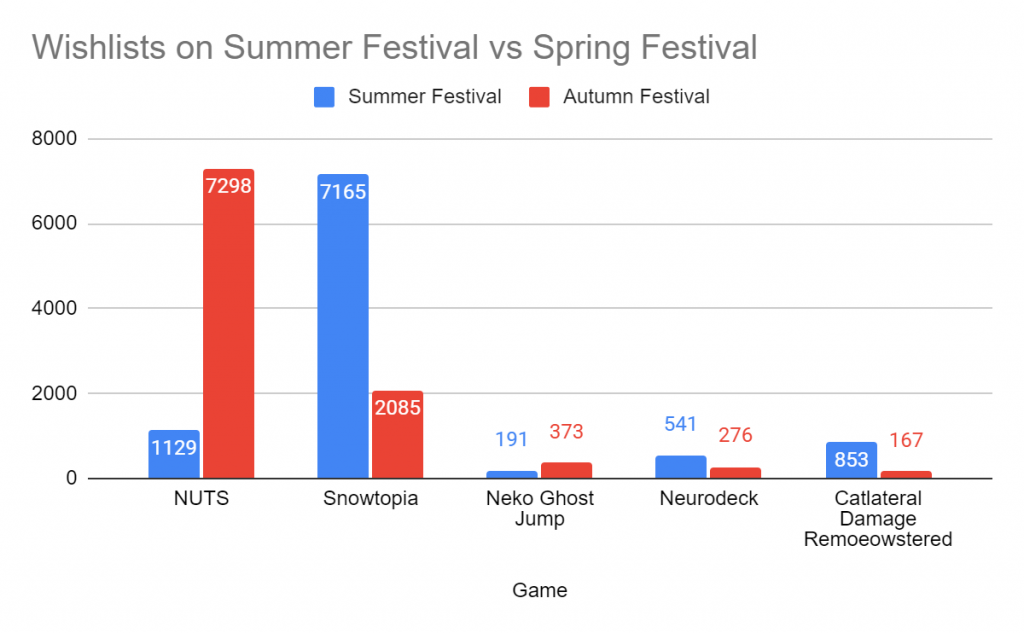
Games that appeared in both festivals did worse the second time (mostly)
Five games that I surveyed appeared in both the Summer and Fall festival. As you can see here 2 games did better in Autumn (NUTS and Neko Ghost Jump) than they did in Fall. In the case of NUTS it was featured in Autumn but not in the Summer festival. However Snowtopia did much better in the Summer despite getting front page featuring in both festivals. So I don’t know.
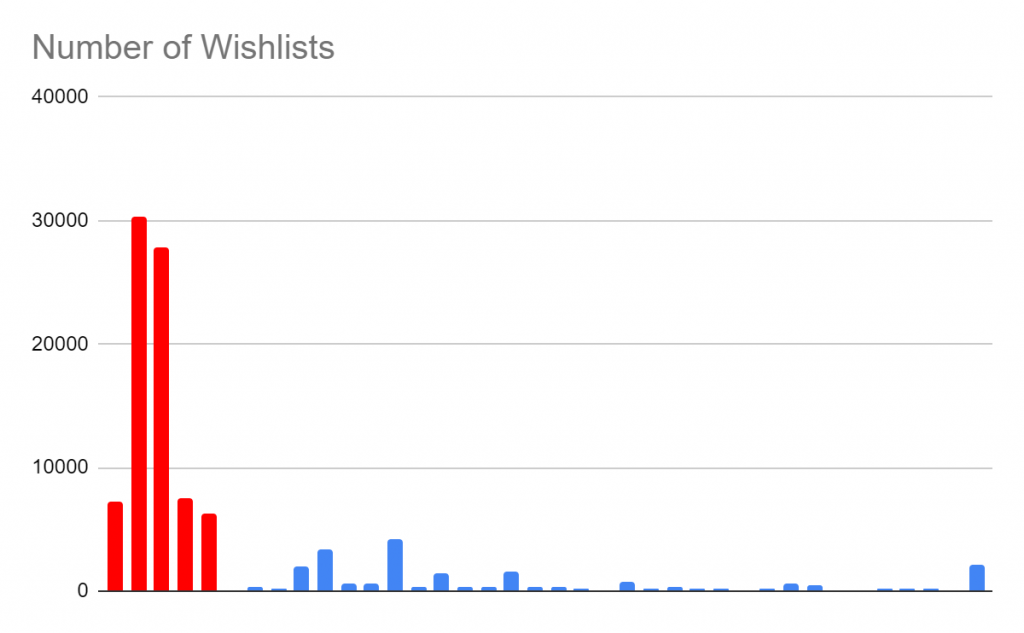
Featuring matters a lot
On the front page of the Festival Steam page there is a very prominent section for “Featured” games. Appearing in here is the most important thing.
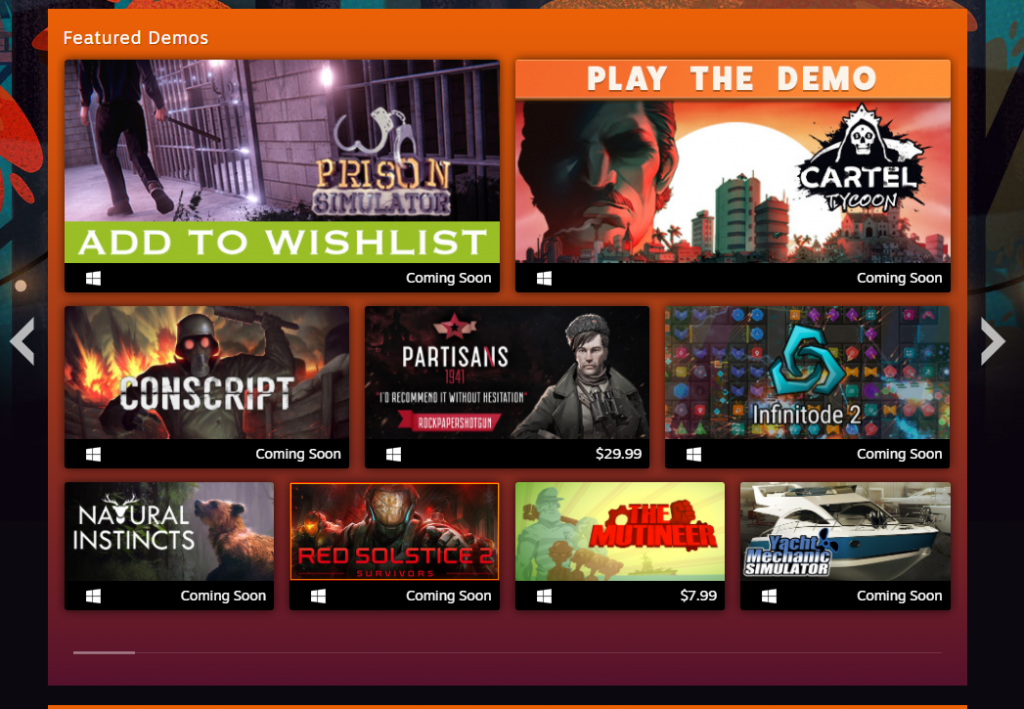
If you chart the number of wishlists earned by each game and highlight the “front-page featured” ones in red, you can see how important that is. Each bar indicates a different game.
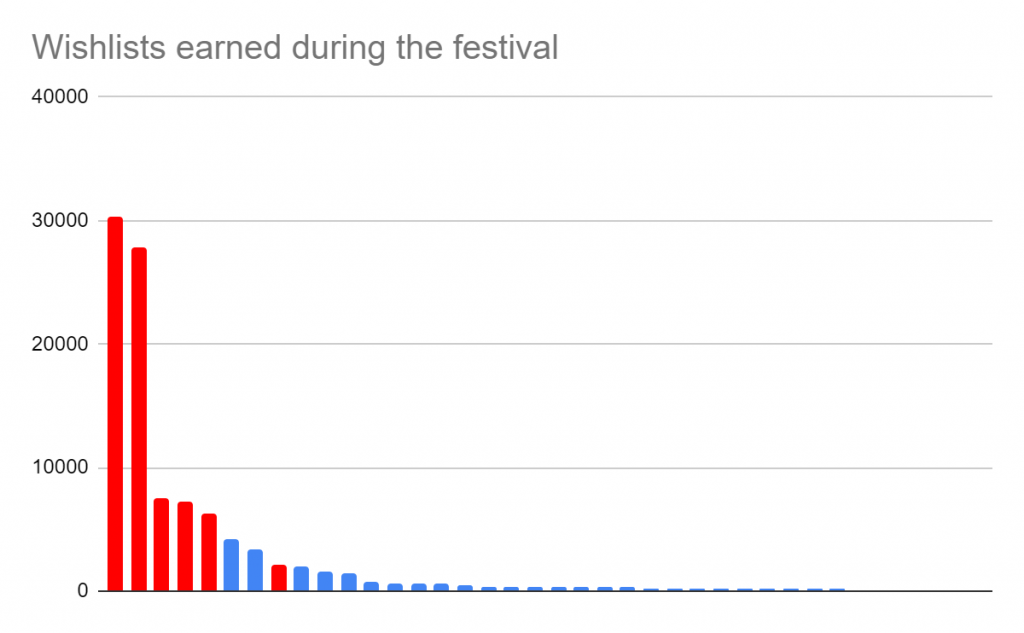
Each genre sub-page also had a smaller featured section. Games that were featured there are highlighted in Green. Getting featured in those sub-sections did not have as big an impact.
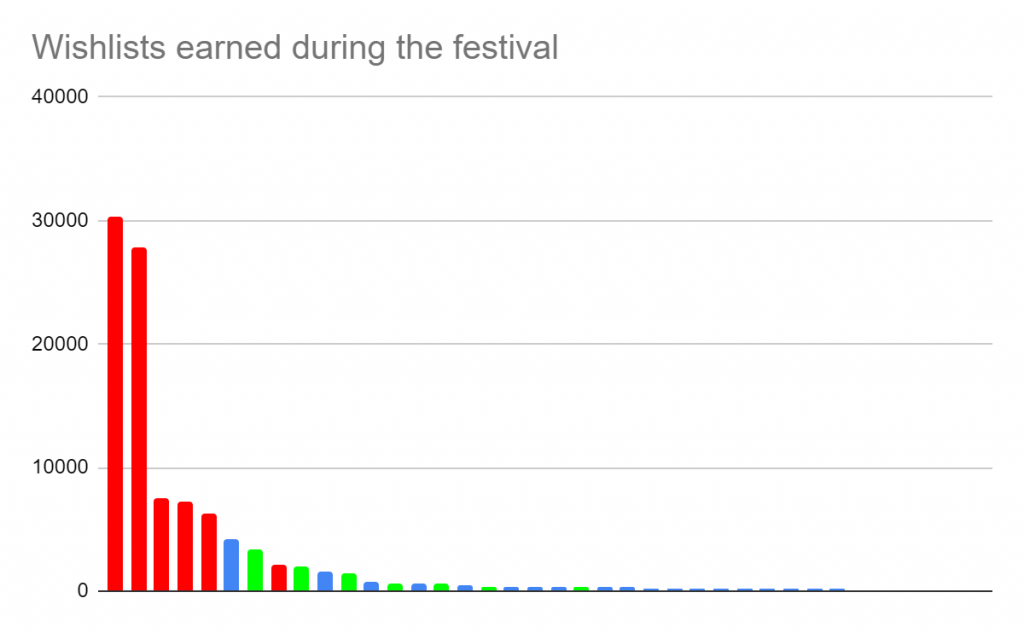
Of the games I surveyed, the breakdown depending on where you appear is as follows:
- Front-page featured got between 30,342 and 2085 wishlists (median = 7414.5)
- Sub-page featured got between 3349 and 25 (median = 378.5)
Also you might notice there is that one game that is 6th-most wishlisted in my survey that did not get any featuring. How? The answer: it was erotica.
So how do you get featured?
Who knows? The 6 games that I surveyed that had front page featuring had the following wishlist counts before the festival started:
- 174478
- 202213
- 23827
- 4476
- 17508
- 35461
There were many other games that did not get front page featuring that had wishlist counts as high as 13,2763 and 98,875. It seems purely based on the tastes of the people at Valve.
Genre distribution
Alright I am not entirely confident posting this chart…. I only had 40 responses so you can’t drive big genre data predictions from this data because of the small sample size. So please grab a big grain of salt before reading this.
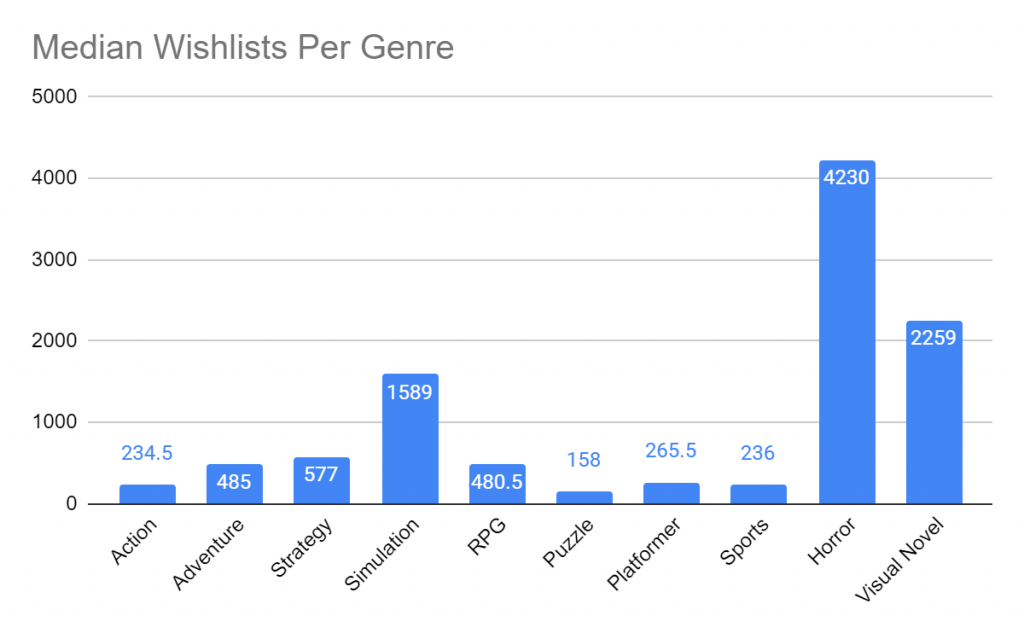
Whoa! You say Horror Visual Novel is the top genre!?!
Wait….
First, there was only 1 game submitted to me in the Horror genre (I told you to watch the sample size). Second, it is that same erotica game that did so well despite not being featured. Let me tell you, that erotica game makes quite the impression.
Here is the number of games per genre submitted to my survey.
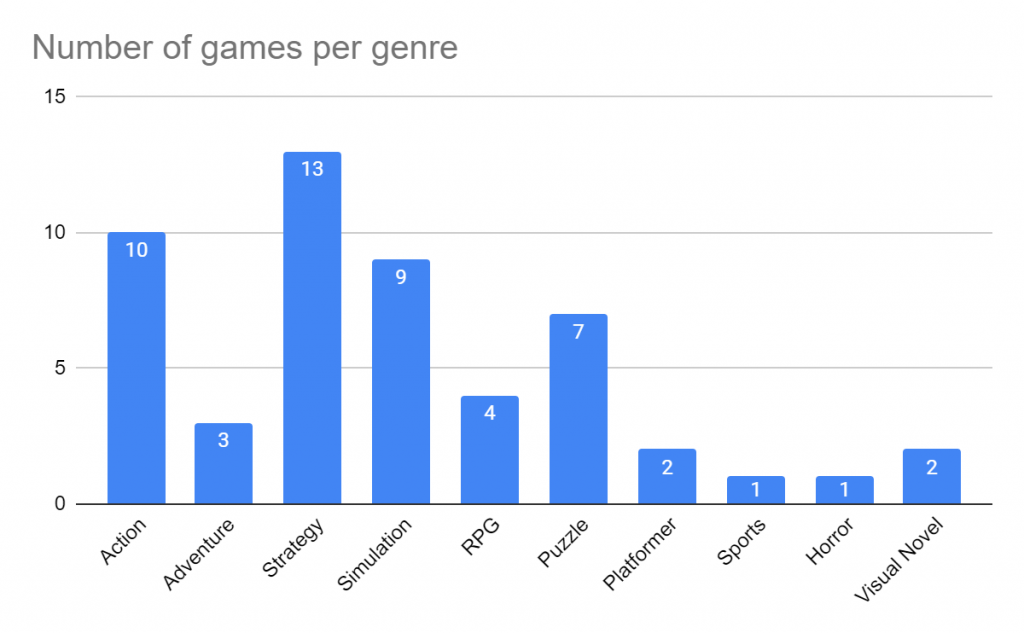
Ignoring the Horror / Graphic Novel / Erotica outlier, you can see the similar trend I saw last time of Strategy, Simulation, and RPG games being the most popular with Steam shoppers.
Exposure Does NOT Equal Wishlists
Ok this one is a bit of weird one that I discovered only because I know the guy behind it.
Look at this chart of the top games sorted by “Impressions.” Each bar is a different game I surveyed for this study ordered by the number of impressions they got. Remember impressions are the number of times your game’s capsule is displayed to a user.
Now all three of the following charts have the same game in the same position. For example, game in spot #1 is the same in all 3 charts, the game in spot #11 is the same in all three charts.
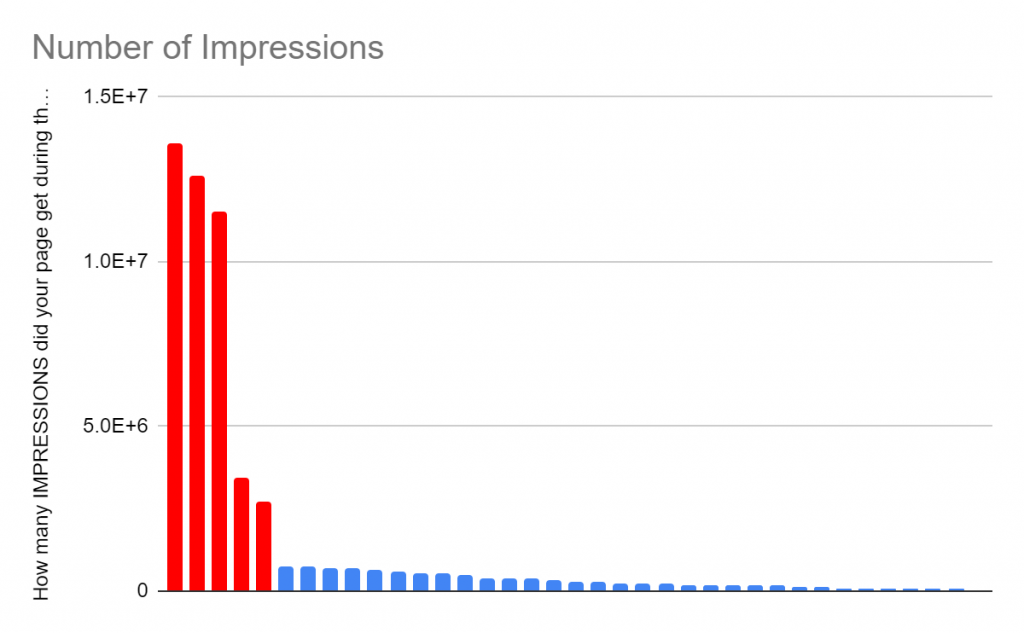
So lets take that ordering and graph the number of visits. It gets a bit weird. (Visits are the number of times somebody clicked the games capsule or they arrived directly on the Steam page.)
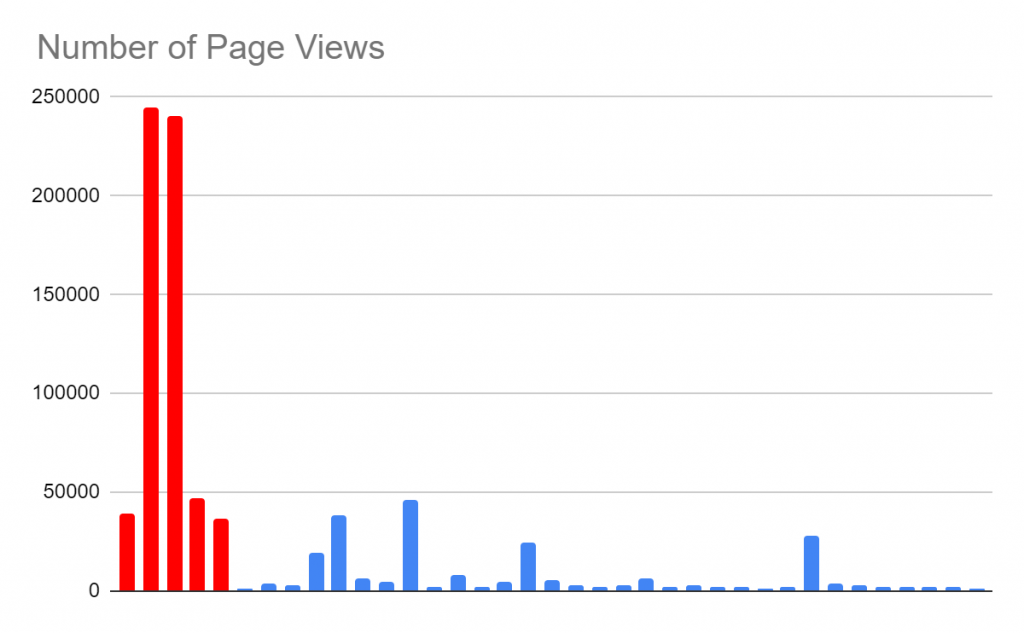
Everything looks normal… except for that first game! Why is it so low?!?
Before I explain, let’s look at the same sorting by impressions but graph the number of wishlists earned.
Everything looks kind of normal, except for that super low game in the #1 spot of that graph again! What happened?!?
Alright, I only know the answer to this because the guy who created the game in the #1 spot told me.
So during the festival he figured out a slightly devious trick to get his game a ton of extra exposure on the festival front store page. He was upfront and told Valve about what he did and they weren’t totally happy with him which is why I am not telling you who he is or what he did.
Using that trick he got to the #1 spot of exposure for the Autumn festival. But look at his Page Views and Wishlists. His little trick didn’t result in the a similar proportion of people actually clicking his capsule or clicking his wishlist button? Why!?
Well my friend with the dirty trick has a kind quirky indie game. I totally like it and it is a really cool game, and looks pretty, and is of high quality, and is interesting. But his game is… well… quirky and in a genre that is a bit different than what most Steam players like. On the other hand, the games in the #2 and #3 position of those charts are Everspace 2 and Stronghold Warlords – the pinnacles of the type of game that Steam loves. They are deep, strategic, with RPG-elements, crisp visuals, involve building stuff, upgrading, skill trees, and complex menus galore.
Basically my friend’s quirky indie game got SO MUCH EXPOSURE but a ton of Steam shoppers saw it and still said “nah I am not going to click that capsule, I want to wishlist this deep space game called Everspace 2.”
The moral of the story
Exposure does not equal sales! Even if you could wish upon a cursed monkey paw to get your game permanently pinned to the front page of Steam, if it is not the genre that Steam players like, they aren’t going to buy it.
If you like to complain on Twitter that Steam is exposing trash games and not enough artisanal indie games, you have to realize that it isn’t just about exposure, it has to do with the types of games you are making. The typical Steam audience prefers a certain type of genre. Even if your game is shoved right in their face every time they boot up Steam, they will still pass you by unless you make the types of games they want.
Games with great Steam Pages
Let’s look at this graph again.

This is the one where the games are sorted by impressions but I am graphing number of wishlists. Look at those games out in the blue long tail that shoot up like mushrooms after a rain.
I love looking at these games because despite getting a shitty placement on the Steam store (to no fault of their own) they overperformed and made the most out of the exposure they got.
Those games are worth studying because they are doing something right! Here they are, in order of their appearance. Unfortunately only 2 of the games said they were ok with me sharing them so I just added the genres next to them. Again, builders, strategy, and naughty games are all really punching above their weight when it comes to steam.
- Marble Age: Remastered (Builder Strategy)
- [Redacted] (Builder)
- [Redacted] (Erotica game)
- [Redacted] (Builder)
- Hostile Mars (Builder tower defense)
Moral of the story
If you have a good concept and fit with genres that are popular on Steam you can convert wishlists better than games with similar exposure levels.
Streaming helps (or is correlated with lots of wishlists)
As part of the festival you can pick what days and what times you want to stream your game. When you pick a time, your game appears in a special “schedule” widget.
Some people never streamed their game others streamed their game every day. There were 7 days in the festival so 7 times they could get featured. Did it help?
To find out, I sorted the games by how many times they streamed (most is on the left, fewest on the right) and graphed the number of wishlists earned as part of the festival.
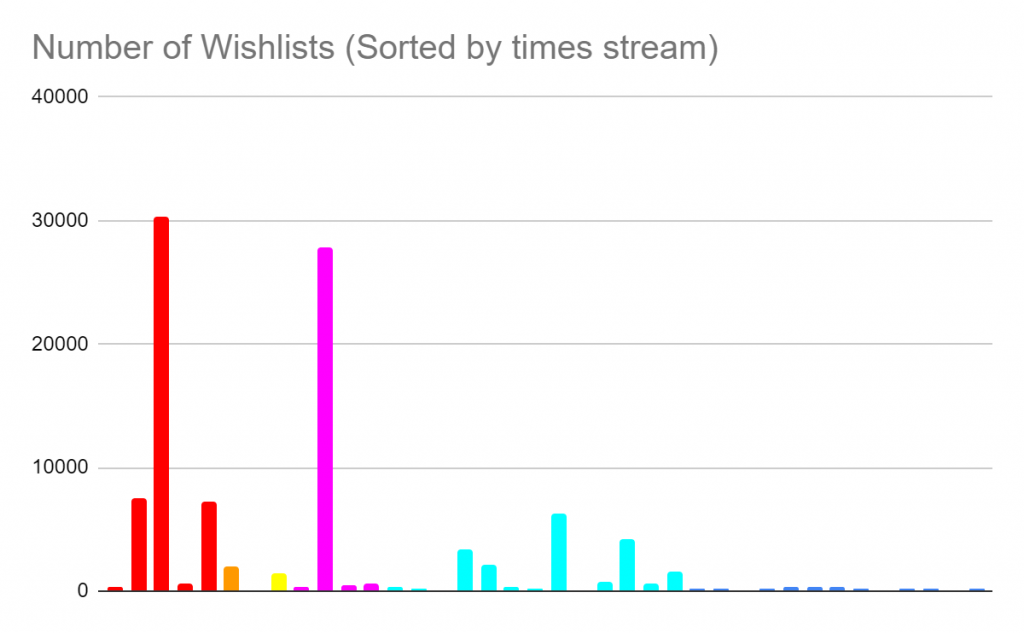
Color codes for number of times streamed:
Red = 7, Orange = 5, Yellow = 4, Magenta = 3, Cyan = 2 , Blue = 1 or 0 times
Moral of the Story
I don’t know. I can’t tell if this is causation or correlation. If you have a really good wishlisted game it is probably because you spend a lot of time on it so have more time to stream it? Or all that extra exposure results in more wishlists?
To be on the safe side, schedule yourself a stream every day of the festival.
Summary
Yes getting tons of wishlists is important. I would still recommend making a demo and putting your game in any Steam festival that comes up.
However, you should also worry about how your page is converting traffic into wishlists during no-featured times. Simon Carless recently published a blog about how not all wishlists are created equal and wishlists earned during these “events” might not convert at the same rate as wishlists earned during “resting periods.” Check out Simon’s Post here/
If you want to check out my report of the last Steam Summer Festival. Check out my post here.