
A good Steam page is not necessary to have a hit game. I look at hundreds of Steam pages and I have to tell you that AAA, or big studio games usually have the least optimized pages: wrong tags, boring short descriptions, long long long trailers and screenshots that are nothing but stills from cutscenes. Yet they sell millions of copies.
So why bother?
Because we don’t have a million dollar marketing budget so we have to make the most we can with what we got.
If you don’t optimize your Steam page, you are missing out on thousands of wishlists every year.
In this week’s column, I will show you a real-life example of how very minor differences in Steam page performance can have very different results.
Two very generous game designers agreed to shared their data with me. You should thank them, you should buy some copies of their games, and if you make games in their genre, you should look at partnering with them. They are good devs.
IMPORTANT NOTE: Before we look at these games note that I do not think either of these games are bad or their Steam pages are poor. Both of them do a lot of good things with their pages. Instead, I think it is important to look at them as an example of how small differences amplify to big results.
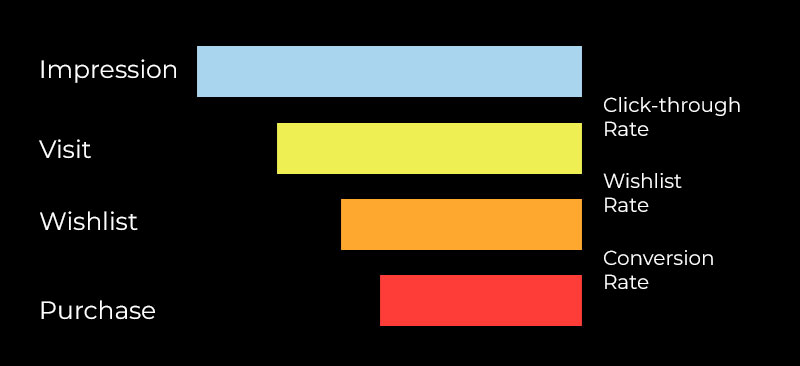
Now as you know everything is a funnel (wait you don’t know everything is a funnel?, read my explainer post on funnels). For Steam, the funnel goes like this:
- A Steam shopper sees your game’s capsule image on some sales page. Valve calls this an Impression.
- If the shopper likes what they see in the capsule, they will click it. Not everyone will click so the ratio of people who do click over the number of impressions is called the “click-through rate.”
- Once your store page loads, and the shopper browses it, this is called a “Visit”
- If the shopper likes your game they click the “Wishlist button.” The ratio of Wishlists to Visits isn’t reported by the Steamworks backend, but you can calculate it by dividing Wishlist by Visits. (I will call this the “wishlist rate”)
Now the number of “impressions” is not quite under your control. The Discovery Queue, Special promotions, putting your game on sale, showing up in other game’s more-like this section all affect your impression rate. You just have to hope your game shows up in the right, high traffic pages.
All levels of the funnel under “impressions” are under your control. For example, you can commission a more attractive and more genre-specific capsule to increase your click-through rate. You can also improve your Steam page to increase your wishlist conversion rate.
A real-world example
Since the number of impressions are not really under your control what if we compared two different games with nearly the same number of impressions. How would the wishlists change if they had a different click through and wishlist rates?
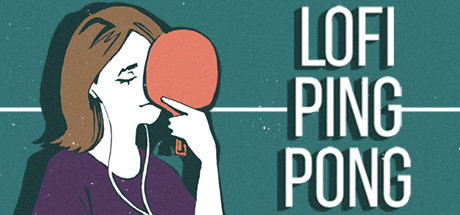
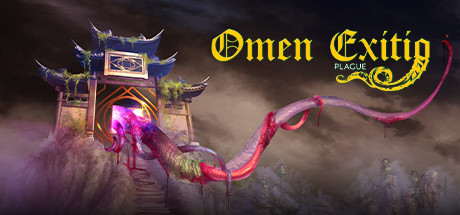
Luckily that’s what I found with Lofi Ping Pong and Omen Exitio: Plague.
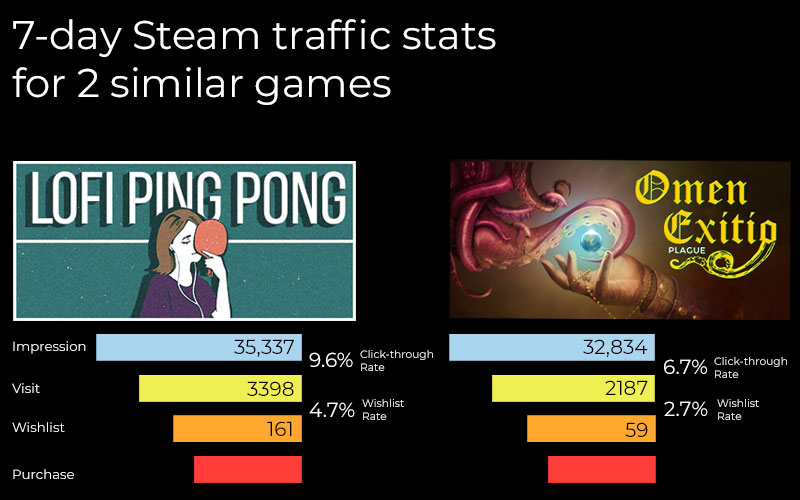
The numbers you see above are from the Steamworks statistics during a resting week. I define a resting week as 7 days when their games were not part of any big Steam promotion, the game was not discounted, and no major external marketing effort was going on like a streamer or an article from the press. Boring, typical day.
As you can see, both games had their capsules exposed about 35,000 times during the week. Now the difference between the games was only 2503 impressions. Omen Exitio had only 7% fewer impressions than Lo Fi Ping Pong.
Further down the funnel Lofi Ping Pong had a 9.6% click-through rate compared to Omen Exitio which had a 6.7% click-through rate. Just a few more shoppers thought Lofi’s capsule was interesting enough to warrant a click.
Once on the page, shoppers reviewed the page and for Lofi Ping Pong, 4.7% clicked wishlist. The number isn’t drastically different for Omen Exitio, about 2.7% clicked the wishlist button.
Let’s look at that click-through rate again: 9.6% vs 6.6%. That doesn’t seem like that much. Nor does the wishlist rate of 4.7% vs 2.7%. However, when you follow users down the funnel, those minor percentage differences resulted in Omen Exitio having one third the number of wishlists as Lofi Ping Pong!
161 wishlists per week for Lofi vs 59 for Omen. Quite a difference.
What happens over a year?
Lets pretend that both games maintain this same baseline traffic / conversion level for another 52 weeks (they won’t! There are always sales and weird boosts from influencers and social media). But let’s just pretend.
Those minor percentage point differences down the funnel mean that in 1 year, Lofi Ping Pong would earn 8372 wishlists while Omen Exitio would only earn 3068.
To put that in perspective, a pretty good Imgur post that reaches the front page will earn you about 500 wishlists. That means that Omen Exitio is missing out on the equivalent of 10 viral Imgur posts per year.
A decent featuring during a Steam Festival will earn you about 1000 wishlists. So Omen Exito is missing out on 5 of those per year.
It adds up
When your page is not optimized, every single article written about your game could have resulted in more wishlists. Every streamer who covers your game will yield fewer wishlists. An unoptimized page is like trying to haul water up a hill with a leaky bucket. All your effort is less effective because water flows out the bottom of it onto the pavement below.
Recommendations
How much time do you think about ways of getting Streamers or press to cover your games or influencers to retweet you? Compare that to how much time you spend optimizing your Steam page click-through rate? It turns out tiny percentage improvements over a long time can have a major impact on the number of wishlists you get. Far more than any 1 promotion you might be able to finaggle.
A lot of people ask what a “good” conversion ratio is for each level of the funnel. That is not always easy to answer because it depends on your game’s genre, how big and expensive the game is, whether you are signed with a publisher, how many other games you have on Steam.
I recommend that instead of comparing yourself to some global number, try to improve your numbers in relation to your past performance. Check your store page stats regularly. Fiddle with tags, the capsule image, short and long descriptions, (but not all at the same time.) Track the changes week by week to see if they improve your conversion rates. The most important thing is that you are improving your percentages compared to your past self.
Also compare stats during similar promotional environments. For example, don’t compare a resting week to a week in which your game is on sale.
If you want more information on improving your page review these articles:
- Steam 101: How to tag your game
- Trends for Steam Capsule Design
- How to broadcast your game on Steam
- 10 Ways to improve your Steam pae
- (Talk) Empathizing with Steam: How People Shop for Your Game
Header photo by Sergio Mena Ferreira on Unsplash