The results of that were as follows:
🥉 0 – 40 wishlist / week
🥈 15 – 120 wishlists / week
🥇 100 – 700 wishlist / week
💎 300 – 3000 wishlists / week
The basic findings are:
- Clickthrough rate doesn’t matter because the games that are most popular are shown EVERYWHERE where is good but it hurts the ratio of clicks / impressions. Games without traffic nobody visits so the clickthrough rate is very high.
- It is more important to look at the number of wishlists you are earning (see typical numbers above).
- Games with the most impressions are also the games with the most wishlists.
In today’s blog I want to look at specific causes. Why do some games get so many impressions even when they are doing anything big like getting streamed by influencers or are in a big festival?
Should you translate your Steam page?
Valve recommends we translate our Steam pages. I believe them but many people ask if it really matters because it is another cost you have to account for. Here is the data from the games in the survey.
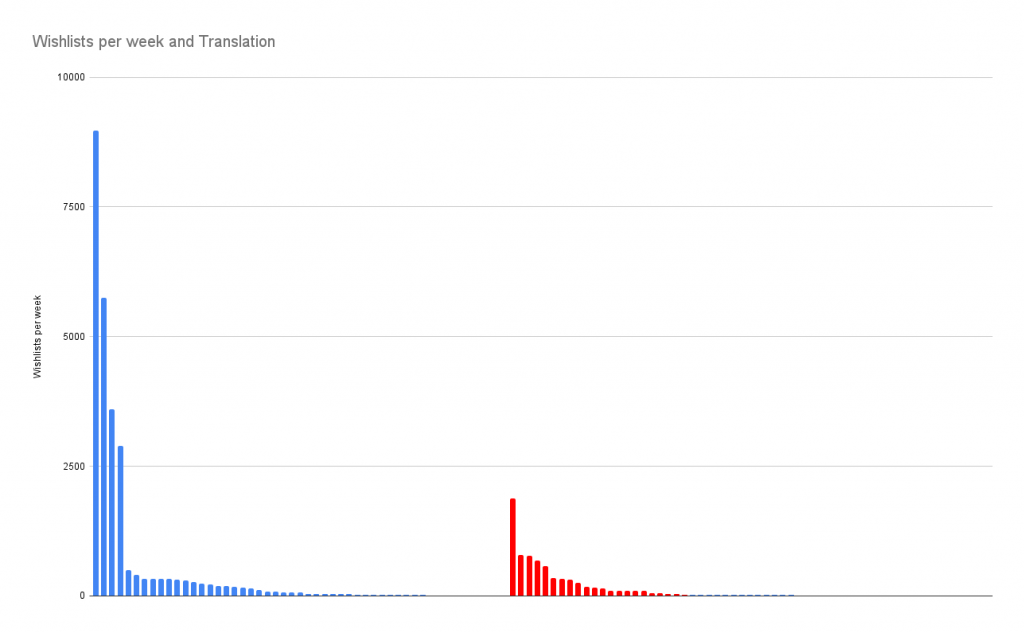
Games that have been translated into English and at least one other language are in blue. Games that are English only are in red.
Pages Translated into more than one language:
| Median Wishlsits / Week | Average Wishlists / Week | |
| Pages translated to multiple languages | 62 | 529 |
| English-only pages | 18 | 124 |
My Analysis
The numbers are really something! It seems obvious that translation helps, however there are a couple factors that might be swaying the data so dramatically.
- Translation can be complicated, time consuming, and expensive. Therefore only games with very organized full-time teams, bigger budgets, or have publishers, are likely to do it. Those games are also typically made by developers with more experience and therefore higher quality which results in more wishlists.
- I find developers usually translate their Steam Pages later in the development cycle. Games that have been around for a while have been marketing for longer and so typically have a higher wishlist velocity. Meaning more wishlists.
But that said, I do recommend you translate your page even if you are not sure if you are going to translate your game into that language. If you chose to translate just the page, you should also provide a warning at the top of it that says something like “At launch our game will not be translated to <language> but we will monitor the number of wishlists and will translate to the languages that have the most wishlists first. So be sure to wishlist so we know there is interest”
Another question is, should I delay posting my coming soon page as I wait for translations. If you are doing a big splashy announce with a big festival and you will be covered on sites like PC Gamer, yes make sure you have at least a few translated pages. If this is your first game and you are completely unknown, just post your steam page as soon as possible and add translations as your time and budget allow.
Valve also recommends that to get the biggest bang for your buck, you translate to Japanese, Korean, Chinese first because the French, Italian, German, Spanish, speakers are more likely to also understand English.
Do Demo’s Hurt or Help your Wishlist?
One of the big questions with hosting a demo on your steam page is if you should leave them up all the time or only during festivals. The fear by many indie devs is that if you have a demo, players will satisfy their curiosity after playing your demo and never wishlist it.
So, as part of the survey, I asked developers if they had a demo available to play during the week they sampled. Here are the results. Blue bars are games with demos, red bars are games without them:
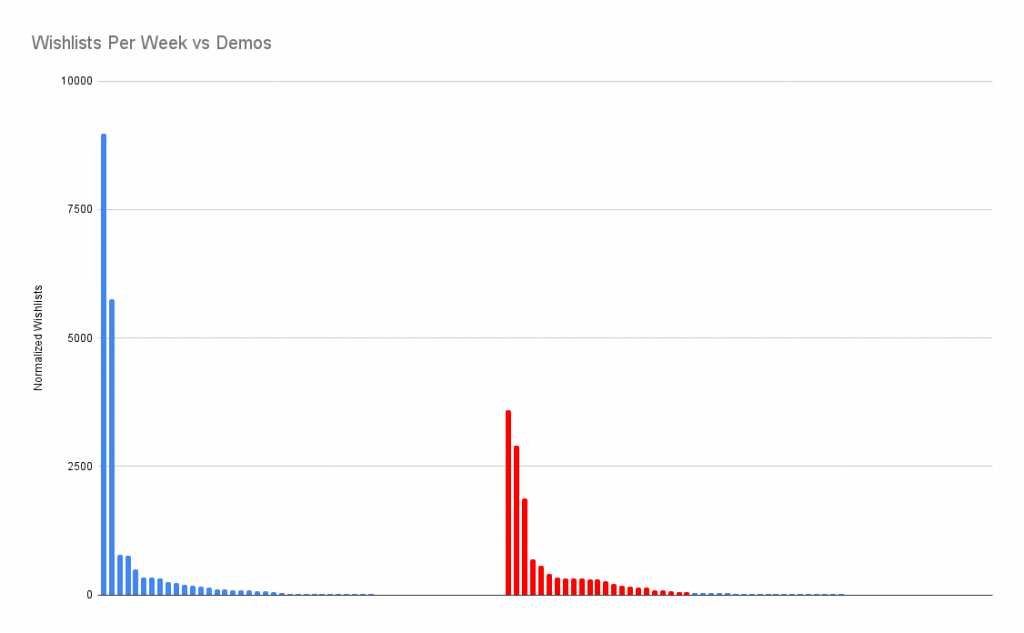
As you can see the games that did VERY well had demos. They are both Vampire Survivor Style Games.
| Median Wishlsits / Week | Average Wishlists / Week | |
| Pages with a demo | 22 | 399 |
| Pages without a demo | 24 | 232 |
My Analysis
As you can see the median is almost identical whether you had a demo or not at the time of the sample. The Average is higher with a demo but I think that is the VS-likes increasing the average (both of them had a demo live).
Despite the data not clearly pointing one way or the other, I strongly recommend making a demo and keeping it up because it allows you to have a spike if a Streamer finds your demo and randomly decides to play it. Remember this data is explicitly sampled from non-promotional-spike periods. It is like sampling an elite runner heart rate when they are resting weeks before a race. You can’t tell how fast they can run unless you sample during the race. A demo helps you during those exciting spike periods.
Where does all this traffic come from?
The big mystery I wanted to solve comes from this Impressions per Week graph that I posted in my previous week.
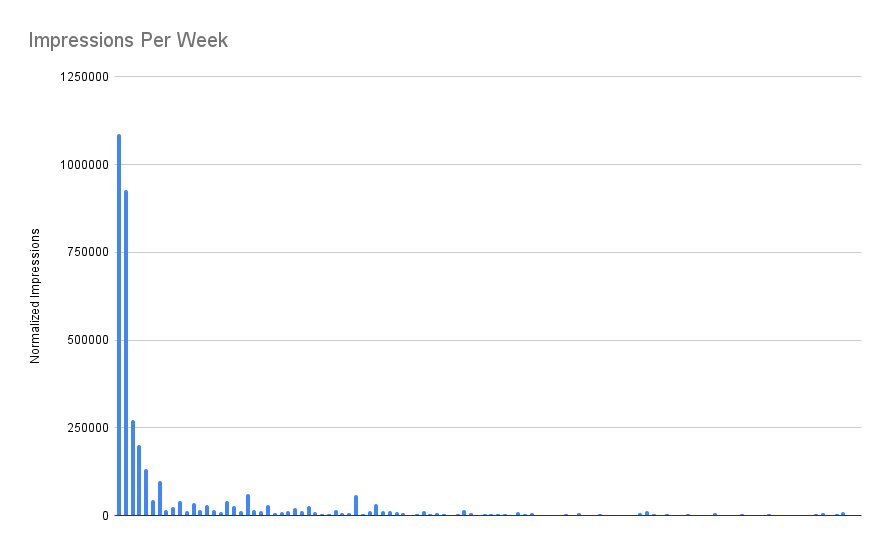
The top earning games all have significantly higher impression rates every single week. Why? Remember I sampled RESTING rates which means this isn’t because they were covered by a streamer or they had a viral tweet. They are getting tons of visibility without doing anything!
So where is all this traffic coming from?
I have 2 theories:
- Theory 1: The Steam algorithm somehow favored some games and gave them tons of visibility from the various widgets.
- Theory 2: There is “background radiation” from Streamers. The youtube algorithm has a very long tail and a video can still drive traffic months after it went big. So maybe these top earners are getting traffic from a spike that occurred weeks ago and it just looks like a resting rate.
I asked developers to send me their top 5 traffic sources as listed by the Steamworks backend.
Top 5 earning games in the survey:
- (other pages), Steam Client – Library, Search Suggestions, Discovery Queue, More Like This (in this order)
- home page, discovery queue, more like this, direct navigation, recommendation feed
- Search suggestions, external website, direct navigation, direct search results, (other pages)
- More Like This, Wishlist, Tag Page, Home Page, (other pages))
- Search suggestions, wishlist, external website, (other pages), direct navigation
5 games right in the middle of the visibility ranking
- Direct Navigation (other), Bot Traffic (other), Bot Traffic (Browse Search Results), Bot Traffic (Coming Soon Lists), Other pages, Discovery Queue, Direct Search Results
- Direct navigation (other), other pages (other), bot traffic (other, browse search results, coming soon list, dlc parent app link), free to play hub (coming soon list), direct search results (search results)
- Direct Navigation, Other; (other pages), (Other); Bot Traffic; Wishlist, Wishlist Image; Direct Search Results, Search Results
- Direct navigation ,other pages, bot traffic, tag page, comming soon – full list
- Direct Navigation, Discovery Queue, Coming Soon – Full List, (other pages), External Websites
5 games at the bottom of the pack
- Direct Navigation, Bot Traffic Browse Search Results, (other pages), External Website
- Direct navigation, Other, Bot Traffic, Browse Search Results, Search autocomplete
- Direct Navigation, (other pages), Bot Traffic, Browse Search Results, Direct Search Results
- Direct Navigation, Bot trafic, Other Pages, External Website, Search Suggestions
- Direct navigation, other pages, bot traffic, external website, browse search results
My analysis:
So games in the middle to lower end of the scale all have “Direct Navigation” as their number 1 traffic source. Valve defines direct navigation as
“Hits in the browser where we could not determine the origin. This may be a link that was clicked in an app on the user’s PC, a website that sets rel=’noreferrer’ on links, a bookmark, or other navigation not accounted for in External Website. Many sites set rel=’noreferrer’ on user-supplied links, including Reddit, Twitch, Discord, and many others. “
Steamworks backend hover tooltip
The other source is Bot Traffic. This is from all those scraping sites like Steam Spy, or SteamDB, or VGinsights. These are just the static that permeates the air. Every page has that. The similarity is that all these games get basically no traffic. It is these slim slivers of traffic that is almost like someone’s cat ran across the keyboard and accidentally typed in your game name.
For top earning pages, the top source is always something unique. Sometimes you see Steam internal widgets doing the referring like “Discovery Queue,” “More Like This”, “Tag Page.” That indicates that valve has “blessed” this game and is using the algorithm to direct traffic to them. But I thought I would see much more Discovery Queue in these top earners. But I don’t. Discovery queue is a fickle widget that randomly shows up and dumps a ton of traffic on your page if you do a big promotion. Then Discovery Queue runs away never to return again. For all these games Discovery Queue was never the #1 source but it did show up.
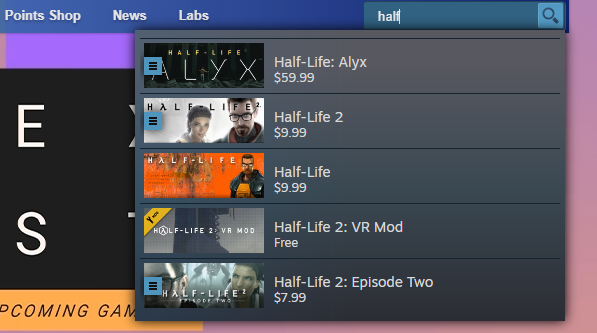
Another source are the external sources like “Search Suggestions” or “Search Results.” Both of these sources are attributable to when a users types the game’s name into a box at the top right of steam. This means that someone knew that games name and was explicitly looking for it.
Here is an example screenshot: if I were to click any of these capsules it would increase its “Search Suggestion” count by 1.
When I look at my client’s data, I usually see a lot of Search-related traffic when the game has been covered by major streamers. Typically, people watch their favorite streamer on a mobile device, then run over to their PC and type in that game’s name to learn more.
But “Search” traffic might also indicate a friend verbally telling them about a game and they are looking for it. This is word of mouth in action.
This Search-related-traffic indicates that these huge traffic boosts come from thousands of random people hearing about these top earning games from just old good word of mouth. These games are exciting and people are talking about them on podcasts, on streams, on playgrounds, and at work. It is just in the air.
Bonus question: How popular do I need to be before Steam and word of mouth promotes me
So after looking at this traffic data I started to see that basically every game that is not the SUPER DUPER POPULAR games has the same traffic sources:
direct navigation, (other pages), bot traffic
Those are the 3 basic sources. Everyone had those 3 basically in that order. It is Steam’s default setting.
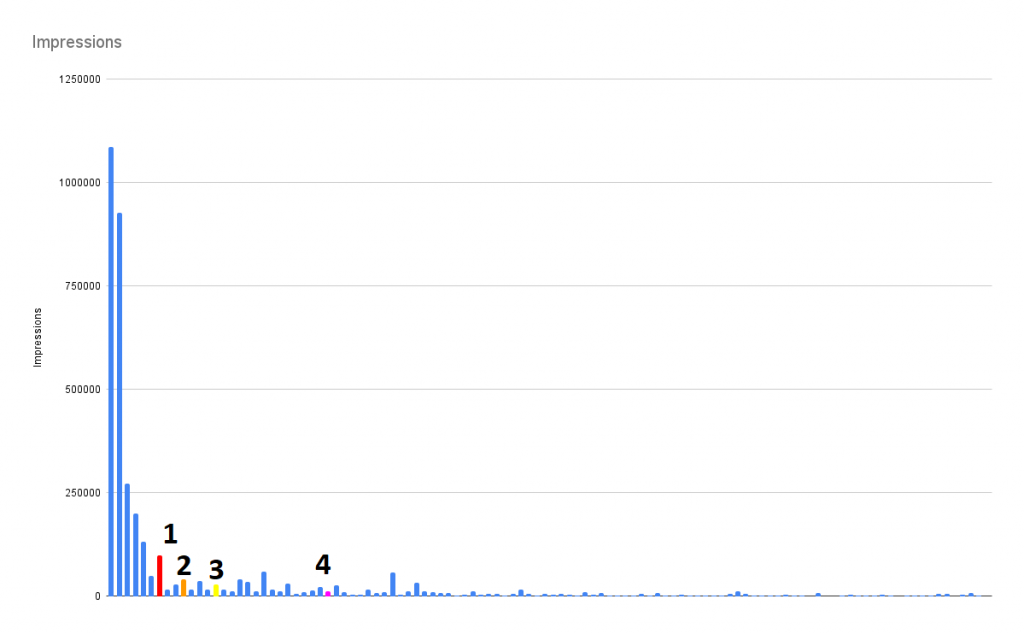
So, at what traffic level did these “3 basic sources” stop showing up and when did I start seeing the more diverse sources that I noticed with the top earners? Here is the breakdown with the chart labeled for each stepdown in traffic
- 98763 impressions is the first time I saw a game with Direct navigation being the primary source.
- 40920 impressions is the first time I saw a game with Direct Navigation then (other pages)
- 29317 impressions was the first time I saw games repeatedly get the (Other Pages) then Direct Navigation, combination
- 12517 impressions was the first time I saw the big 3 all in order direct navigation, (other pages), bot traffic
After #4, all the games below that are basically direct navigation, (other pages), bot traffic over and over again.
So does low traffic cause Steam to hide you from all the other widgets? Or does the lack of widgets cause the low traffic? I think it is a bit of both. If your game has a ton of word of mouth AND you are getting lots of traffic, steam widgets start showing you more.
Summary
So what did we learn?
- I can’t prove it, but you should probably translate your Steam page
- Keeping your demo up has no direct effect on your resting wishlist rate, but it CAN have an effect on getting you more spikes (you just can’t see it in this survey because I was focusing on resting periods)
- The high levels of visibility partially come from Valve widgets and from word of mouth.
I am sorry, there is no one weird trick. Just make a game worth talking about.