
Benchmarks
This post is part of my series on marketing benchmarks that will help you understand how your game is doing and what is normal. To learn more, check out the full benchmark series by clicking the button
So, everyone asks me “what is a normal, organic clickthrough rate?”
Here it is:
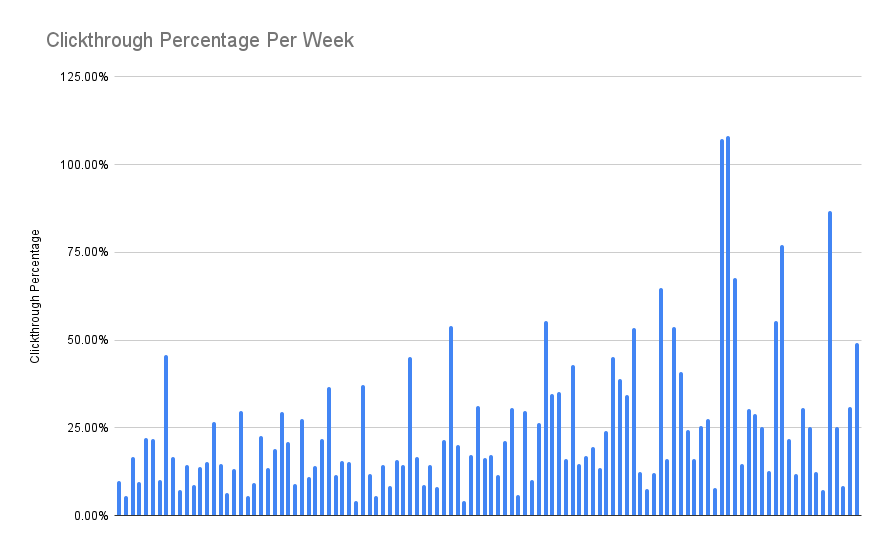
It is complicated. Let me back up,
When you are featured in a festival or a streamer is covering your game, your traffic numbers are crazy high. But as soon as that heavy featuring is over, the numbers drop back down to a baseline. I wanted to know, though, what is a typical baseline?
I have worked with games that have very high baselines and games that have very low baselines. Why are some games blessed and others hidden in Steam’s broom closet?
So I sent out a survey to developers and got data for over 100 games. I specifically asked them to send me a 1 week stretch of time, before the game was released, where they were not actively promoting their game and there were no big promotional spikes.
In this blog post I will review my high level findings but I don’t try too hard to diagnose why some games are getting all that traffic and others aren’t. Today, it’s just observations. Stay tuned because in my next blog post (sometime next week) I will try to diagnose some causes.
TL;DR What is normal organic wishlist rate
Looking at games based on their total gross earnings, here is what is typical
🥉 0 – 40 wishlist / week
🥈 15 – 120 wishlists / week
🥇 100 – 700 wishlist / week
💎 300 – 3000 wishlists / week
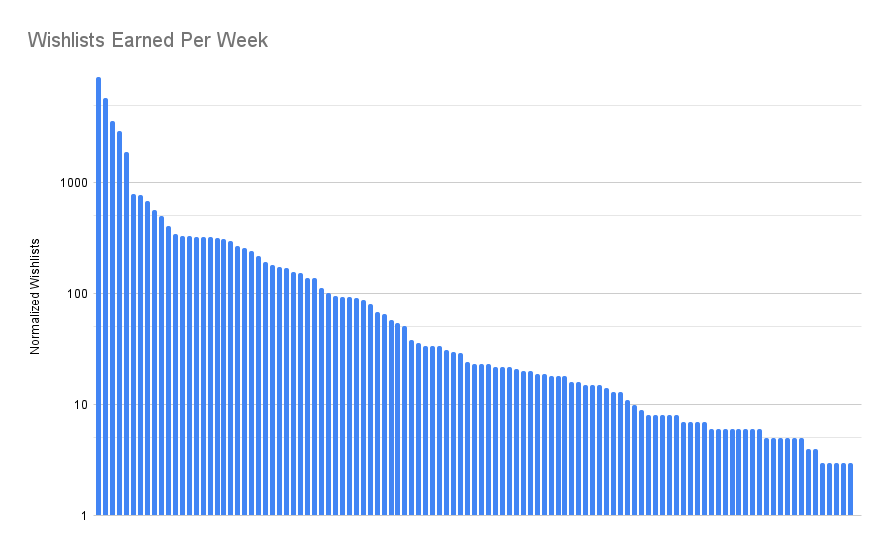
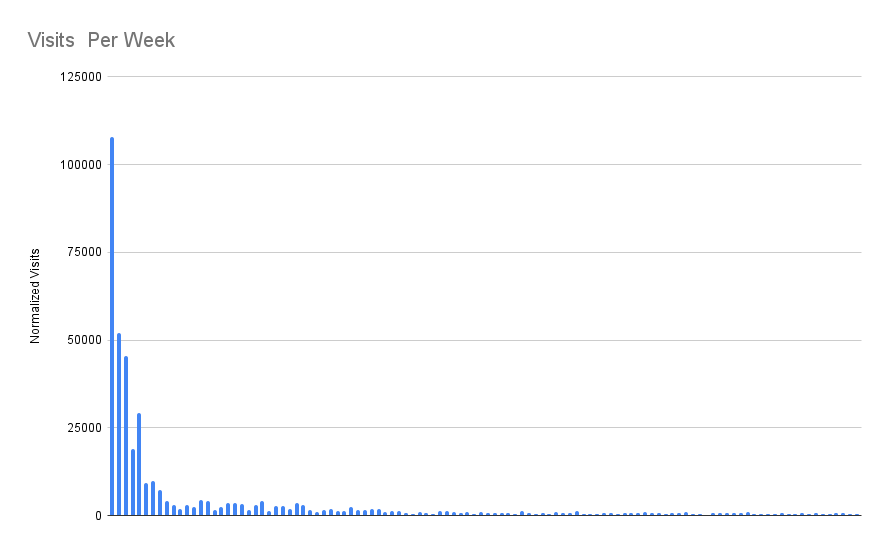
First, lets look at the number of wishlists earned by each game in the survey in a random, non-promotional, week:

Couple notes
- Each blue bar in this graph is a different game in my survey.
- The Y-axis is the number of wishlists earned in 1 week.
- I sorted the games by the number of wishlists earned.
- For all the graphs in this blog, I locked the graphs so they are all sorted by number of wishlists earned. For example, in all these graphs, the 3rd bar over is the exact same game.
First, yes, a few games earned over 5000 wishlists in a week. Those games are Horde-Survivors aka Vampire Survivors-likes. I cannot overstate how crazy popular that genre is right now.
So let’s go to a log scale so it is easier to look at
So, everyone asks me “what is a normal, organic clickthrough rate?”
Here is that graph again
Reminder, this graph is still sorted so the games that earn the most per week are on the left side, games with the fewest per week are on the right.
Look at how noisy that is.
There isn’t much of a correlation between the number of wishlists you earn and the click through rate.
So in short, stop worrying about Clickthrough rate. Because of the way Steam surfaces games, it isn’t as important as other things (I will explain more in my next post.) But in general I wish Steam didn’t expose it.
There is a very slight relationship between weekly wishlists and weekly clickthrough rate. I added a basic trendline here.
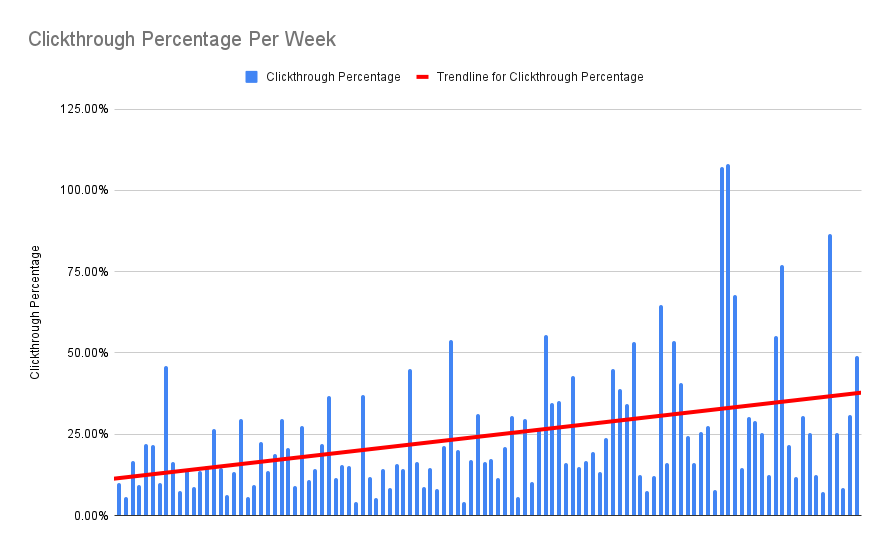
See that! Ironically, the less traffic a game has, the better click-through-rate is.
Wait? What?
Remember Clickthrough rate as calculated by Valve is
# of page views / # of capsule impressions The super duper popular games (like those two hoard survivors) are being promoted like CRAZY by Steam and by streamers. Those top games are so exciting that Valve has taken notice and are showing their capsules everywhere on Steam. So the impression rate is SUPER high.
But, because those capsules are exposed to so many people, the proportion of people who actually would be interested in that game is lower.
On the other hand, those games that have very very low weekly wishlist rates are basically buried by Steam. Nobody is being shown their capsule so their impression rate is very low. The only people who are actually landing on the page were personally sent there to it by a developer through social media or their discord. So the ratio of page views is quite high when the denominator of the equation is the super low impression count.
So, basically, don’t worry about click through rate. You actually don’t want a high click through rate because that probably means Steam isn’t showing you.
What are the impression / view rates?
Want more proof that clickthrough rate is a worthless number?
Look at this chart of impressions. Again this is sorted so the games that earn the most wishlists per week are on the left.
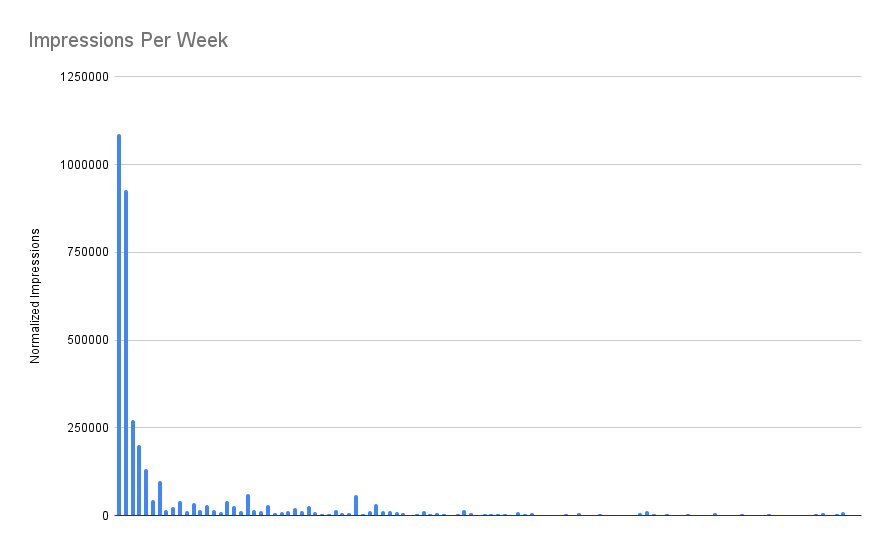
See? Nice and smooth graph. The number of impressions correlates to the number of wishlists earned.
Similarly, the number of page views per week correlates to the number of wishlists.
So, don’t worry about the click-through rate. The thing that matters really is impressions and page views. You want to increase the number of impressions to increase the number of wishlists.
How? I will talk about this next week.
What are normal wishlist rates?
So basically wishlists earned per week is what really indicates whether your game is finding an audience. When developers ask me what the typical click through rate is they are really asking, “am I on the right track or wrong track and is my game going to fail?”
If I do a simple median of the weekly wishlist rate of all these games you get this really dumb number:
23 wishlists per week!!!
That is fewer than 4 wishlists earned per day.
That is fewer than 1400 wishlists earned per year without any big promotions.
Remember, on Steam, the median indie game will fail.
To fix this, if the game had released, I asked developers what their gross (pre Steam cut) revenue was.
I then divided the earnings into 4 buckets
🥉 Bucket #1: Earnings of $0 – $10,000
This revenue bucket indicates that the game underperformed by most measures. I mean if you made the game in 1 week and earned $5,000 that is pretty good. But most indies don’t do that. So this result is usually a disappointment to most devs.
🥈 Bucket #2: Earnings of $10,001 – $249K
This bucket is still quite low but could be considered profitable if you are doing this part time, or as a hobby. The reason I stopped at $250,000 is that once you earn more than this number, Steam usually starts to give you some additional promotion. More on that in the next bucket …
🥇 Bucket #3 (Real Steam) $250K – $999K
In my experience, the Steam algorithm is kind of tuned to promote games that earn in this range. Valve and the Steam algorithm really starts promoting you automatically once you earn more $250K. For instance, Valve will usually approve you for Daily Deals at around $250,000 gross lifetime revenue. Usually. Also it is at this level where I start to see the various widget algorithms start to show the game. That is why I call this “Real Steam.” Basically Steam kind of starts working for you at this earnings level. You probably aren’t rich, but you and your team can start using the various Steam tools to promote your game.
💎 Bucket #4 (Life Changing money) – $1 Million+
This bucket is for the games that earn the real money. This is life changing money. This is the bucket that I think one indie once called “F#CK you” money. This is the bucket that every indie secretly hopes for when they launch their game.
Now, with those buckets established, let me give you my gut-check, ball-park, mental-model numbers of what weekly wishlist numbers look like for games in each of these buckets.
🥉 Bucket #1 = 0 – 40 wishlist / week
🥈 Bucket #2 = 15 – 120 wishlists / week
🥇 Bucket #3 = 100 – 700 wishlist / week
💎 Bucket #4 = 300 – 3000 wishlists / week
Some caveats about the buckets
You will notice that there is a lot of overlap between these buckets. If you earn 400 wishlists a week your game could either be a mild hit or could be yacht-life money.
That is because wishlists cannot predict sales. In those Valve Q&As, they always remind us that even with their complete access to all the metrics across all games, they cannot predict how much a game will sell.
This is where Goodhart’s law usually comes in. Developers can goose the numbers up, slice them in a way that appeals to their argument and convince themselves that they will become the next hit.
So be mindful when looking at these numbers.
I have seen games with weekly wishlist rates at Bucket #4 levels. But at launch, the game had major bugs, or their marketing mis-identified the genre and gameplay, or the game was too difficult, or it looked good in screenshots and trailers but it played janky. The fans revolted (or were apathetic) once they were able to play the game. So, don’t quit your day job if your weekly wishlist rate looks like it might be in Bucket #4. Wait until you launch first.
Also, your current wishlist rates aren’t life sentences. Almost every game starts small and slowly builds an audience and might some day reach Bucket #4. For instance, Peglin definitely earned Bucket #4 money upon release (I wrote a whole blog post about how Peglin earned more than 1 million in its first week.) but in the first 6 months on Steam, it was earning at Bucket #1 and #2 levels. But after launching a demo, they found an audience among streamers who played it over and over and then the game quickly shot up to Bucket #4 weekly wishlist rates.
If you have marketed your game very very hard for months and months, and have put out a demo, and reached out to streamers, and entered festivals, and you got high wishlist spikes, but the wishlist rate quickly settles back down to low Bucket #1 levels, that could be a sign that sales aren’t going to be great.
If your game’s resting rate has never reached Bucket #3 or #4 levels, and usually is at Bucket #1 levels, you probably are not going to be earning “F#CK you money.” I am sorry.
What can be done to fix this?
Next week I will be deep diving into specific factors to see what could be causing some games to be at Bucket #4 vs Bucket #1 weekly rates.
Unfortunately, in the end, I think it comes down to the game. Love is mercurial and there is no simple formula of Character + Genre + Setting + Art Style + Music = $$$.
The alchemy of these elements mixed in one way is a hit, but mixed up in another way is a bomb. It is frustrating and confusing. If you want to read more I wrote a blog post about why some games are feathers and some are bowling balls.
Sorry to end on a downer.
But, just know that if you are stuck in Bucket #1 or #2 land, keep at it. The game you are working on now might never reach the #3 or #4 levels. But, careers are long. It is possible to get to Bucket #3, #4 with the right game. I have seen it. I have talked to people who have done it and they are quite normal, quite down to earth. It is elusive but amazingly fun when it happens.
Sign up for my newsletter to be reminded when I post my follow up blog post.