
Benchmarks
This post is part of my series on marketing benchmarks that will help you understand how your game is doing and what is normal. To learn more, check out the full benchmark series by clicking the button
It may be apocryphal but the U.S. WW2 General Dwight D. Eisenhower is often credited with saying “Amateurs talk strategy. Professionals talk logistics.”
After studying Steam long enough I would say “Amateur game devs talk about visibility. Professionals talk Discovery Queue.”
I am here to tell you that you aren’t thinking about the Discovery Queue (DQ) enough. If you say “Well I never use it, who cares?” then you definitely need to read this blog post.
The DQ (discovery queue) is this silly little widget that is buried a ways down the front page of Steam.
Here is a picture of it:
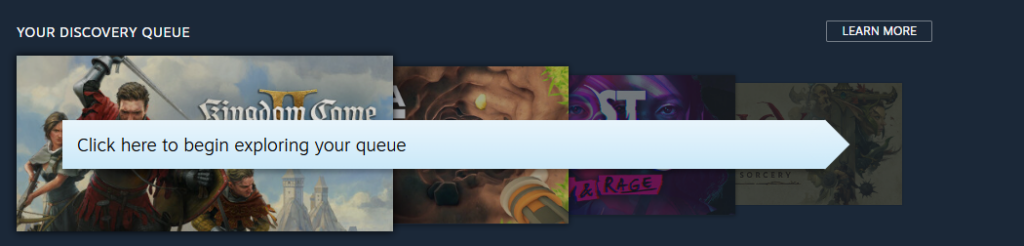
All the DQ does is recommend you 12 games that the Steam algorithm thinks match your play history based on the tags of your most regularly played games and a little bit of algo magic. You should take a moment to try it out for yourself….
Go ahead…
Click through it right now.
Welcome back. How did it go?
Even if you don’t use the DQ or have never heard of it, your game will be impacted by it because a lot of very very engaged Steam users swear by it. It is extremely popular among the most hardcore of the hardcore shoppers who buy dozens of games per year. These weirdos are the people who will take a chance on your game. To read more about how the Discovery Queue works, check out my blog here
If your game ever miraculously “went viral” and earned about 3000 wishlists within a 7-day period there is a SLIGHT CHANCE that your game was included in the DQ before launch. I wrote a blog last year detailing what it takes to get these pre-release DQ featuring and how awesome the impact is.
But today I am looking at the Discovery Queue behavior when your game launches (both Early Access and full normal launch). All games automatically get some visibility in the DQ at launch.
I have found that for most games, the DQ accounts for ALMOST HALF of a game’s total page visits during the 2 weeks of launch. The DQ is the reason you pay Valve 30%. It REALLY boosts your game’s visibility.
Since half of your traffic comes from this stupid widget, we should probably look at how this thing works right?
So I sent out a call to the HTMAG community asking them for their DQ data in the 2-weeks following their game launch. What you are about to read is the summation of the survey results.
Benchmark tiers
75 games were included in my survey. I got responses from developers whose games made MILLIONS all the way to developers who didn’t get a single review. The DQ data is remarkably different along this entire spectrum so it is important to bucket the results.
For the entirety of this post, I am going to refer to 4 sales levels based on total gross revenue (pre-steam cut) as reported by the person who submitted their data to my survey. (See the appendix for why I use TOTAL gross)
I bucketed the amount of money each game earned as follows:
💎$1 Million+ (Diamond tier is life changing money)
🥇$999,999-$150,000 (Gold tier is “real Steam” which means the Steam algorithm actively promotes the game and the game made enough that Valve will give you promotional opportunities like Daily Deals).
🥈$149K – $30,000 (Silver tier means the game just didn’t earn enough to be promoted by the algorithm. Usually I see games land here if they were marketed well but there was just a mismatch between the Steam audience and the game. It didn’t catch fire).
🥉 < $30,000 (Bronze tier is usually for first time game developers, very experimental projects that have no intention of following market trends, or games that were not marketed using best practices).
How the DQ works for each tier
How much traffic do games actually get from the DQ? To answer this, I took all games in each revenue tier, then I found the median number of views those games got during the 10 days following launch (Blue Bars).
Then I also took the median percentage of traffic that came from the DQ for each tier (Red Line).
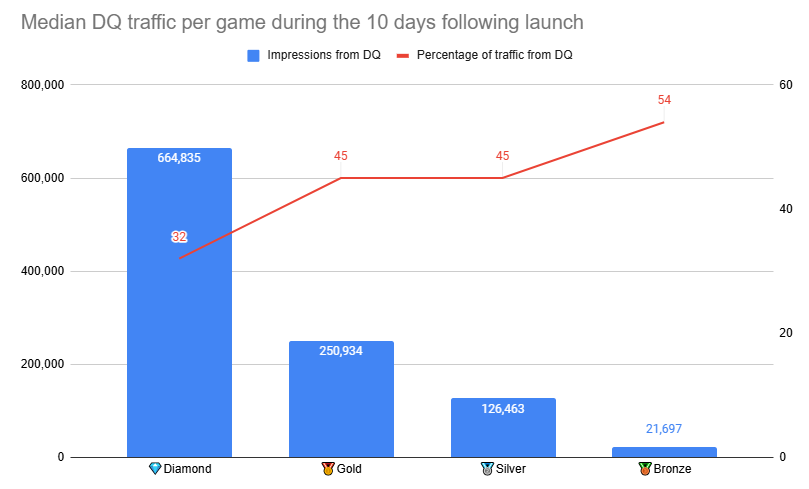
So for example, during the 10 days of launch, the Median Diamond-Tier game will get 664,835 impressions from the DQ and that will account for 32% of their total traffic. A typical bronze game will get only 21,000 impressions and that will be 54% of the page’s traffic.
Analysis:
Basically, those diamond games get SO MUCH MORE traffic from the DQ. The DQ LOVES them.
BUT, as a percentage, for the diamond tier games, traffic is only about a third of the total whereas the other tiers it is close to half. My thought is that when a game is selling at Diamond level, the entire gaming corner of the internet is talking about that game. Huge waves of traffic comes from Youtube, social media, the press. Everywhere. But the other tiers don’t have that ambient effect so see a higher share come from the DQ.
How the DQ works
My theory is that at the start, almost all games are equal in the eyes of DQ and no special treatment is given. After a few days of collecting data on how the game performed in the DQ, the DQ adjusts and gives more impressions to games that do well, less traffic to those that don’t.
I saw this behavior on the micro scale when I was analyzing the games Jonas Tyroller made.
Jonas’s Thronefall is a closer fit to Steam shopper’s preference for “Crafty Buildy” games and you can see how much the DQ loved it (Red line). Will you snail is a 2D platformer, and well you can see how Steam shoppers treat platformers (Blue line).
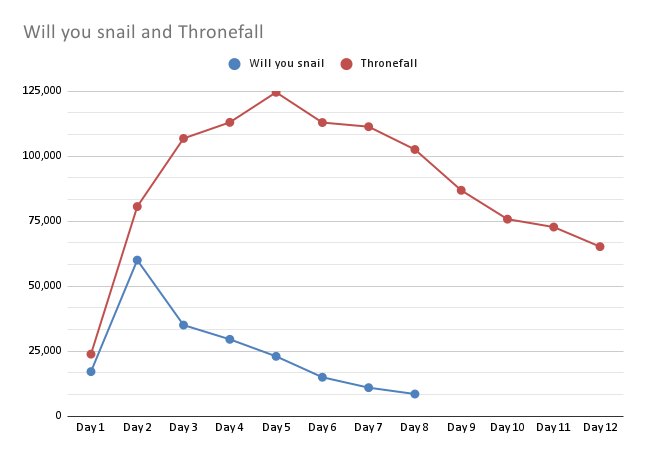
In Jonas’s data you can see the pattern. Day 1 is 25,000 ish for both. Day 2 is an increase for both. Then Day 3 for the game that sells well sees a DQ increase while the game with softer sales sees a decrease in DQ traffic.
I was wondering, was this the case for all games in the DQ?
To test my hypothesis I asked developers to provide me with the number of DQ impressions every day following their launch. Here are the results segregated by revenue buckets. (See appendix for what “Day 1 & 2” means)
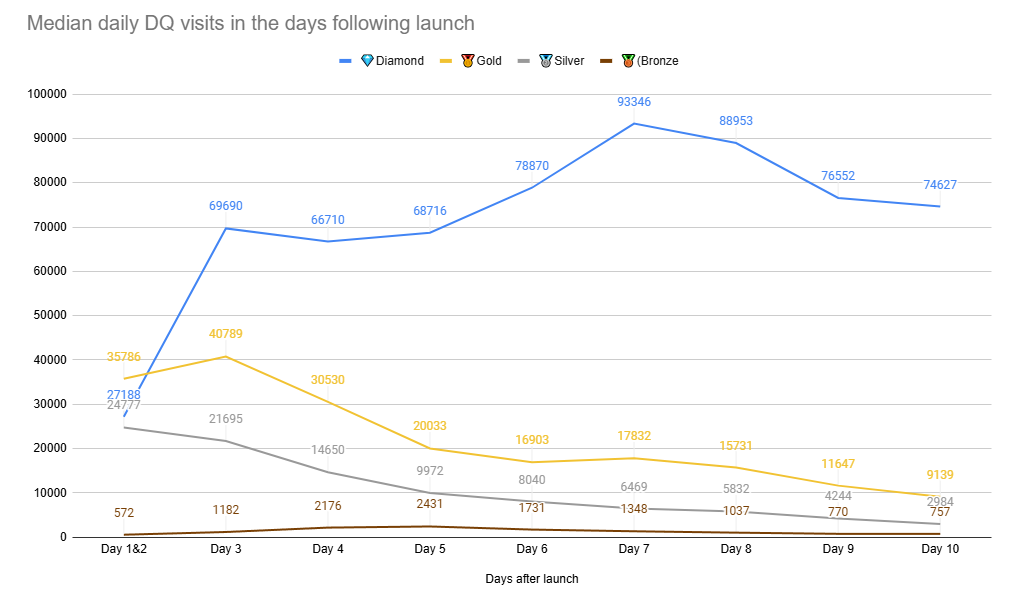
Interpretation:
If you look at the first day of the graph, you will see that all of the top tier earners get around 24,000 – 35,000 impressions (in fact, in my data set, 🥇Gold games got slightly more impressions than Diamond). That is basically the DQ treating all games equally.
But, by Day 3, the DQ starts to have an opinion. Diamond game impressions shoot WAY up. The DQ LOVES them. Gold games shoot up too, but not as high. Silver games get their impressions throttled.
Then over the next week things really start to change. Diamond games are held steady; in fact by Day 7 there is a second boost in impressions. Remember this data is the median of all the Diamond-tier games in my survey (6 total games). It is really telling that even when the data is pooled and aggregated, you can see that 7 day spike across all of them.
By the end of the week, for gold and silver tier games, the DQ has made up its mind. It is basically saying “thanks for playing, I hope you enjoyed your time in the DQ, please see yourself to the door. Actually we are getting the hook.”

Side note, Jonas’s data for Thronefall and Will you snail is NOT included in the survey data. It is a completely different set of games that had a similar graph shape.
The Bronze Age
Let’s talk about those poor bronze games that aren’t even given a shot at DQ visibility.
Note that they aren’t even given the free 25,000-35,000 DQ impressions at Launch.
Remember, my tier list is based on total revenue AFTER launch. How does the DQ determine how to discriminate against them before it is even on sale?
I went back to look at the Bronze games in my survey and found that just about all of the games launched with one or all of the following disadvantages:
- Launching with fewer than 5000 wishlists
- Short marketing period between launching their “coming soon page” to release
- Slow to earning 10 reviews (sometimes never even getting them)
- Unprofessional capsules
- Low review rating
- Low Concurrent User count (CCU)
The general Discovery Queue thresholding you see in the Bronze tier data is why I don’t think we need to fear an AI flood of games choking out “hand-crafted” games. Valve basically denies the most basic visibility until you prove that you have had some external validation from content creators, festivals, and/or social media. Even if you could quickly make and release hundreds of games using AI, you still need to do a whole bunch of marketing before you are given visibility on Steam.
Also the DQ behavior for bronze tier games are the answer people who say “you don’t need to market your game, a good game will sell itself.” On Steam, you MUST market your game just enough so that you qualify for the game to “sell itself.” If you don’t market your game, you are not using the tools that you are paying for with your Steam 30% revenue cut.
How can I do better in the DQ?
To be honest, I don’t know. Sometimes with Steam, you just have to get mystical. Some games have “the magic.” Something about them is just amazingly interesting to people and they buy the game.
Making a basically decent Steam page that shows off what is unique and fun about your game is important. You need a professional looking capsule that doesn’t look like you are just a hobbyist. You can see how to make a good steam page over at howtomakeasteampage.com
The good news is that it isn’t just about having the best graphics with the best trailer. It is something otherworldly.
For instance, the spaceship building game Cosmoteer is one of the top games in my survey with Diamond Tier earnings and Diamond-tier DQ numbers. But the graphics are simple 2D, and mostly… well… programmer-ish art:

But, when Cosmoteer shows up in the DQ, players wishlist and buy it. Turns out shoppers really do look at games and evaluate them on their merits.
And when I look at the other Diamond Tier games there are a lot of weird, boutique, hand-made, games. It isn’t all just generic AAA shooters. There are cool games that do well there.
I can’t tell you what makes one game good vs another. It’s art. Why does one pop song get stuck in your head while another has you reaching for the “skip” button? Why are ASMR videos popular? Why do some people love pineapple on their pizza?
Human taste is ephemeral and hard to explain. I don’t think we can find one number that if you just fix that, your sales will improve. I don’t have an answer for you. If I knew, I would make that game. But I am not good at that.
I have written other posts about trying to understand human taste and why one game succeeds and another fails. Check these:
If only Steam would show my game more I know it would sell
After lackluster sales, many indies will shout out in frustration “I know my game is good, everyone who plays it likes it! Review scores are positive. Valve just needs to show it more.”
Well, the DQ thinks otherwise.
As long as you meet that minimum basis of wishlists to get the DQ to show the game 25,000 – 35,000 times on Day 1, you can look at what happened on Day 3. Did the DQ give you less traffic? More? Or a WHOLE LOT MORE?
If the DQ cut traffic on Day 3, it is a sign that players looked at the game and went “eh?… NEXT!” Steam gave your game visibility and the players turned their nose up. Why would Steam show your game more when there are other games with much higher DQ numbers? Yes, your game would sell better if Valve showed it more, but there is an opportunity cost where there are limited visibility slots and there are other games that sell even better.
It sucks! This is a hard business. I don’t know what to do.
Summary: So what?
What I love about the discovery queue on launch day is you can’t influence it. The shoppers just click “Discovery Queue” and a grab bag of games are shown to them. I suspect that many of the people looking at your game in the DQ have never heard of it before. The people seeing your game in the DQ didn’t know that you ran ads or posted some dumb meme where you photoshopped your game into Moo Dang’s mouth or something.
The DQ is just an unadulterated connection between your game and the shopper.
Do they like this game without context?
Yes?
Then it survives another day.
They didn’t?
Then fewer people will get to see it.
It’s pure.
You don’t have to wonder, what if I just emailed one more streamer? Maybe if I didn’t launch on the same day as that AAA game.
If you had lack-luster sales, and are wondering WHAT HAPPENED? Check your Discovery Queue. How do your numbers compare to the benchmarks I present above?
Here is how to see the DQ data
- From Steamworks, go to your game and click the button for Marketing & Visibility
- Set the dropdown range to be CUSTOM
- START DATE = the first day to be the day before your games release.
- END DATE = Add 14 days to your START DATE.
- Click “GO”
- Scroll down to the “BREAKDOWN OF PAGES” section and find “Discovery Queue” then look at VISITS.
Compare your daily DQ numbers to the following chart:
Although the survey is over, I am always interested in collecting more data and possibly writing a follow up. If you have a game that launched at least 2 weeks ago, complete this ongoing DQ survey:
Appendix
Why tiers based on total revenue not the 2 weeks? Even though the DQ only lasts about 2 weeks, I think it is important to get a bigger picture of total revenue. As I wrote in a previous post, it usually takes 1 to 2 quarters to really determine if a game is a hit. Also you just need lots of time for games to really distinguish their sales from one or another.
What does “Day 1 & 2” mean in the graph? – Every game launches at a different time of the day relative to the Valve data tracking servers. Some games have a day 1 launch at 11:59PM. Some games at 1AM. Therefore if I ask developers for Day 1 of the launch impressions, the first day for some games might cover just 1 minute of store time, whereas for other games it includes 23 hours of it. To normalize this discrepancy, I add up Day 1 and Day 2 impressions and divide them by 2. That is why in all charts it is called “Day 1 & Day 2.” So in my benchmarks, Day 1 and Day 2 will always have the same number. For instance Diamond Tier Day 1 DQ traffic median should be 27188, Day 2 DQ traffic is 27188, Day 3 DQ traffic is 69690.