I have two goals with this benchmark data.
- Answer the questions “If I enter Steam Next Fest, how many wishlists will I earn based on my current stats?”
AND - “I just participated in Steam Next Fest and only got X wishlists? Is this normal?”
To help you with that second goal I created a tool that allows you to enter in all your data and it will compare your game to other games in the data and tell you where you over and under performed.
About the data
The data in this benchmark report comes from 182 survey responses from games that participated in the February 2026 Steam Next Fest. Sometimes the charts in this report won’t add up to 182 because a number of people decided to fill out the survey twice or decided not to answer questions, or misread the question and entered a number that was impossible (maybe they forgot to convert out of metric wishlist counts?). Weird. So most graphs and tables are made up of about 170 to 174 games.
This data is exclusively from the February 2026 data. I did not mix these results with surveys from previous Steam Next Fests.
Note that I forgot to ask a question about “Pre-Steam Next Fest Velocity” So I sent a follow up email to respondents asking them to fill out a secondary survey. Only 81 people did the second survey. So consider that when looking at the data in the section “But what about wishlist Velocity!”
For deeper analysis and a deep dive into my thoughts I will be publishing a “takes” and “trends” blog post next week. There I will look at how SNF Feb 2026 compared to the previous ones because everyone likes to freak out and say “Steam is always changing.” Let’s look at the data before we freak out.
Finally at the end of this report I have an appendix to previous blog posts and the archive of my last Steam Next Fest benchmark article.
How many wishlists do games earn during Steam Next Fest
I always break my benchmarks down into tiers of performance. For this benchmark report the tiers (💎 Diamond, 🥇 Gold, 🥈Silver, or 🥉 Bronze) are based on how many wishlists the game earned during Steam Next Fest in February 2026.
Here are the tier ratings:
| Tier | Wishlists earned during the February 2026 Steam Next Fest |
| 💎 Diamond | 10,000+ Wishlists |
| 🥇 Gold | 7000-9,999 Wishlists |
| 🥈Silver | 1000-6999 Wishlists |
| 🥉 Bronze | 0-999 Wishlists |
How did I arrive at these numbers?
I assigned 💎 Diamond tier to games that appeared in the top of the top charts like “Most played demos” and saw how many wishlists they earned. Typically it was 10,000+.
I assigned 🥉 Bronze tier by looking at games that were smothered by the algorithms after the first two days. Typically those games earned fewer than 1000 wishlists.
🥈Silver and 🥇 Gold I kind of arbitrarily drew lines between them based on how often they performed. Honestly it was hard to assign the 🥇 gold tier number. It is basically lower-level diamond tier. These are typically the games where you have to push “view more” and scroll down a bit on the top tier widgets on the festival page.
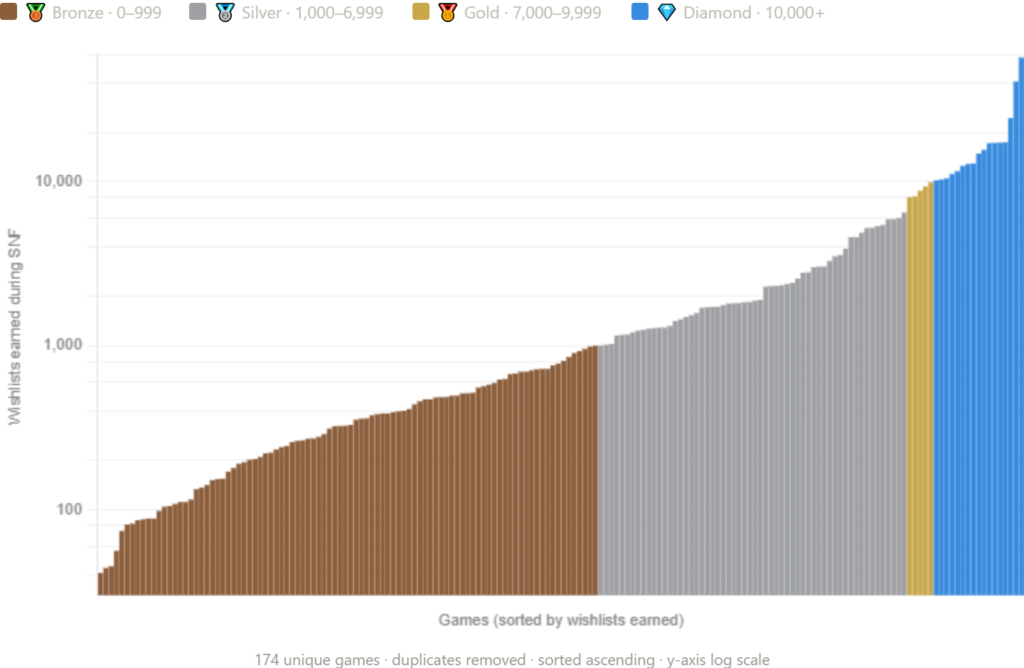
Here is a chart of the wishlists earned during next fest for all 174 games in my survey. Each bar is a separate game. Note the log scale.
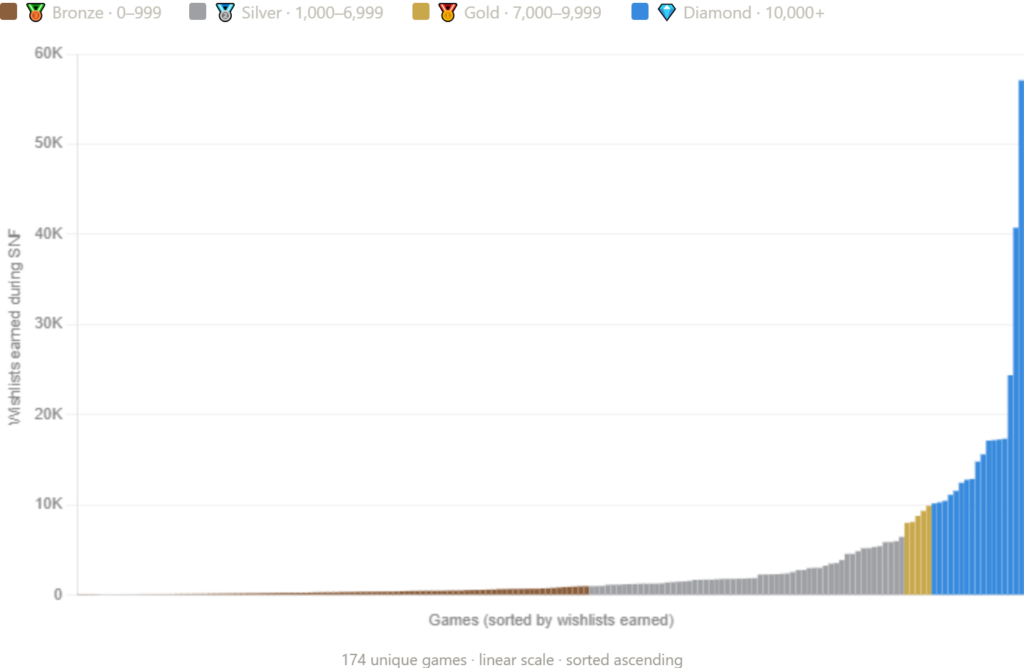
To show how dramatically Steam shows the “Magic” games, here is the same data in linear scale.
Notice how the 🥇 Gold tier games have just a notch higher visibility in this chart. That was my cutoff. Those games just started appearing at the very bottom of some of the ranking widgets which distinguished them from 🥈Silver.
Based on how many wishlists I have going in, how many can I earn?
In my research the strongest correlation with wishlists earned during Steam Next Fest, was the total number of wishlists the game had accumulated before the festival. Pre-fest wishlist count has a Spearman r of 0.825 (1 being a perfect correlation). In short, bigger games enter the event with more momentum and leave with even more.
This is why I recommend waiting until the very last Steam Next Fest before you launch.
In the following chart I show the ranges games earn based on the number of wishlists they had before the start of Steam Next Fest. The left side is how many wishlists before SNF, the range bars are the number of wishlists they earned during it. It is amazing how clearly the tiers aligned.
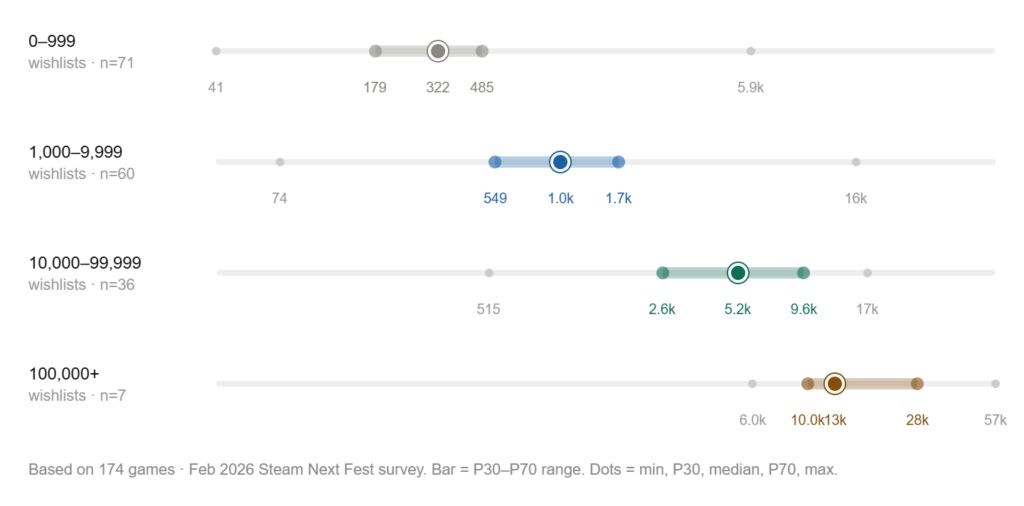
Here is a table of the same data for readability sake
| Total Wishlist 1 day before February SNF | Minimum | 30th percentile | Median | 70th Percentile | Most earned |
| 0-999 (n=71) | 41 | 179 | 322 | 485 | 5,880 |
| 1,000-9,999 (n=60) | 74 | 549 | 1,006 | 1,722 | 15,614 |
| 10,000-99,999 (n=36) | 515 | 2,584 | 5,215 | 9,633 | 17,342 |
| 100,000+ (n=7) | 5,990 | 9,989 | 12,882 | 27,661 | 57,074 |
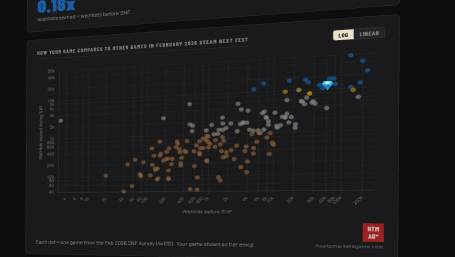
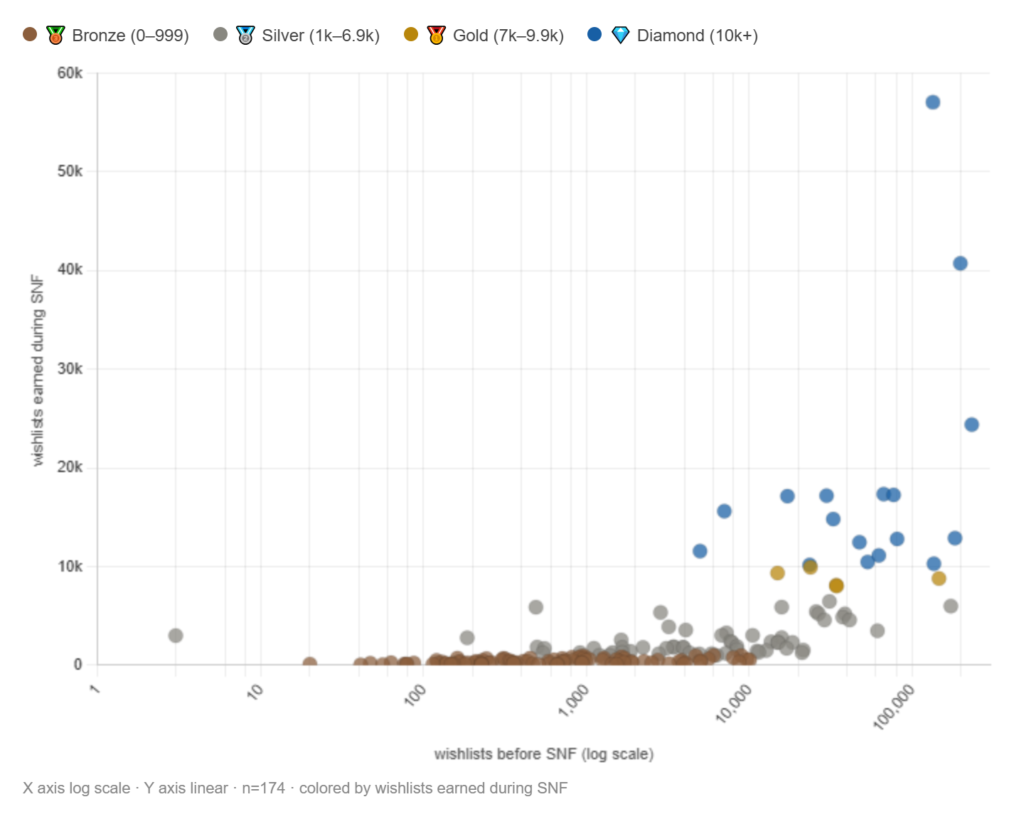
Here is the data presented as a splatter graph of wishlists before vs wishlists earned.
Notice very similar to my previous bench mark report that when your game goes in with >2000 wishlists it there is a bit higher variance and more possibility your game will really do well during the festival.
But what about wishlist Velocity!?!
If I divide the total number of wishlists earned by the age of the game you get a simplified “velocity” number.
(Total Wishlists) / (Age of Steam Coming Soon Page)
It is more impressive if a game earned 10,000 wishlists in its first week of being live than earning 10,000 wishlists slowly over 3 years.
Here is the graph of lifetime wishlist velocity and potential outcomes in Steam Next Fest:
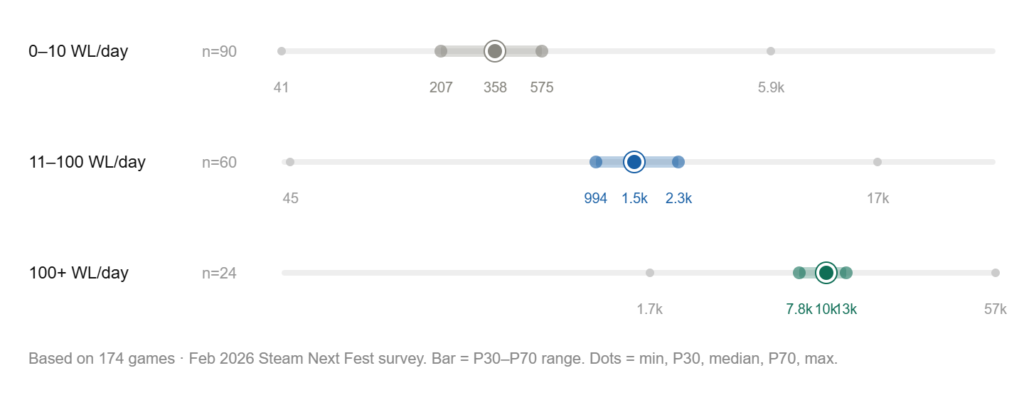
Same data but in table form:
| Wishlist velocity (total WL / Days Steam page live) | Minimum | 30th percentile | Median | 70th Percentile | Most earned |
| 0-10 / day | 41 | 207 | 358 | 575 | 5880 |
| 11-100 / day | 45 | 994 | 1470 | 2304 | 17,342 |
| 100+ / day | 1,711 | 7,816 | 10,229 | 12,506 | 57,074 |
So yes, it is good to have wishlists but it also matters how long it took you to get that number of wishlists.
But what about RECENT wishlist Velocity!
I have seen a lot of chatter lately where developers say “Having a lot of wishlists doesn’t matter any more, if you want to do well in Steam Next Fest recent velocity is what matters now!”
Is that true?
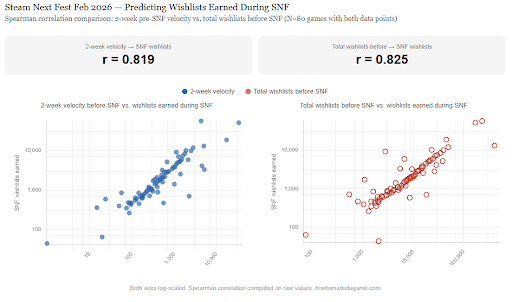
The number of wishlists earned 2 weeks before SNF does correlate to SNF success (r=0.819).
HOWEVER
By a tiny margin, total wishlists are better correlated to a game’s success than the 2-week velocity leading in Steam Next Fest.
Here are 2 charts showing how wishlists Earned correlate to Total wishlists before and 2-week velocity.
So try to get a lot of wishlists, if you can’t, try to get a lot of velocity before Steam Next Fest.
But guess what?
To do either of those options you have to have a good game. I didn’t ask respondents if they had a good game or not, but I believe the confounding variable is whether the game is good. Velocity and a ton of wishlists are just symptoms of having a good game.
Therefore, I think it’s risky to say “well I am going to keep my game secret and do a surprise shadow drop just before SNF to get VELOCITY and MOMENTUM!”
In my mind, that’s risky. You don’t know if you will go viral and get velocity. It is much safer to take a lot of shots on goal and try to get wishlists. That way if you launch your demo and it is a dud, you have time to fix it, improve it, get more content creators to play it and get more wishlists.
More wishlists is the safer play.
So what does “Good Velocity” look like? Here are the number of wishlists earned in the 2 weeks before Steam Next Fest started:
| Total Wishlists earned during SNF | Minimum | 30th percentile | Median | 70th Percentile | Most earned |
| 🥉0-999 (n=35) | 1 | 23 | 58 | 89 | 5,115 |
| 🥈1000-6999 (n=32) | 48 | 312 | 628 | 1317 | 18,341 |
| 🥇 7000-9,999 (n=4) | 4,301 | 4,944 | 5,089 | 5715 | 10680 |
| 💎 10,000+ (n=9) | 306 | 1,623 | 2,039 | 11,953 | 33,135 |
Notice that 🥇 Gold tier games have a higher median velocity than 💎Diamond? I think that is just because in this data set, Gold tier has only 4 games so it isn’t a statistically significant representation of the population. I should really just lump gold into Diamond.
How much will Steam Next Fest show my game?
The Steam Next Fest algorithm supposedly gives a BASELINE of visibility to all games in the fest for the first couple of days and then based on performance metrics rewards top performers with more visibility at the expense of underperformers.
Pay special attention to the word BASELINE.
I did not say “EQUAL” visibility (Reddit kids always get this wrong.) Think of the SNF algorithm as if it puts a floor on the number of impressions every game gets by randomly showing ALL games in the first two days. Top earning games still get more impressions because they appear in widgets such as “Most played demo” “most wishlists” and other special widgets. Also there are widgets called “On your wishlist.” If a game has a lot of wishlists, it will appear in more shoppers’ customized Steam Next Fest page, thereby increasing the number of impressions.
I asked in the survey for the game’s daily “Impressions” attributed to the Steam Next Fest store page. This is not influenced by impressions from content creators or social media. Only impressions from SNF.
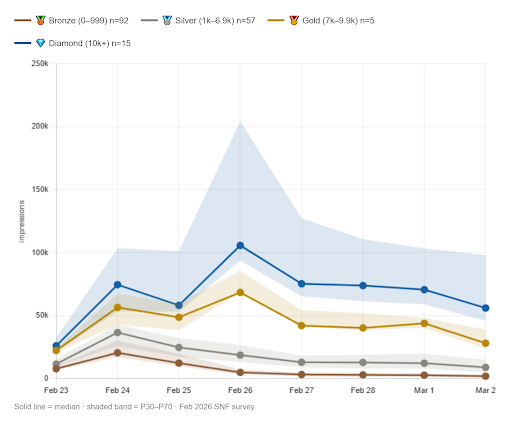
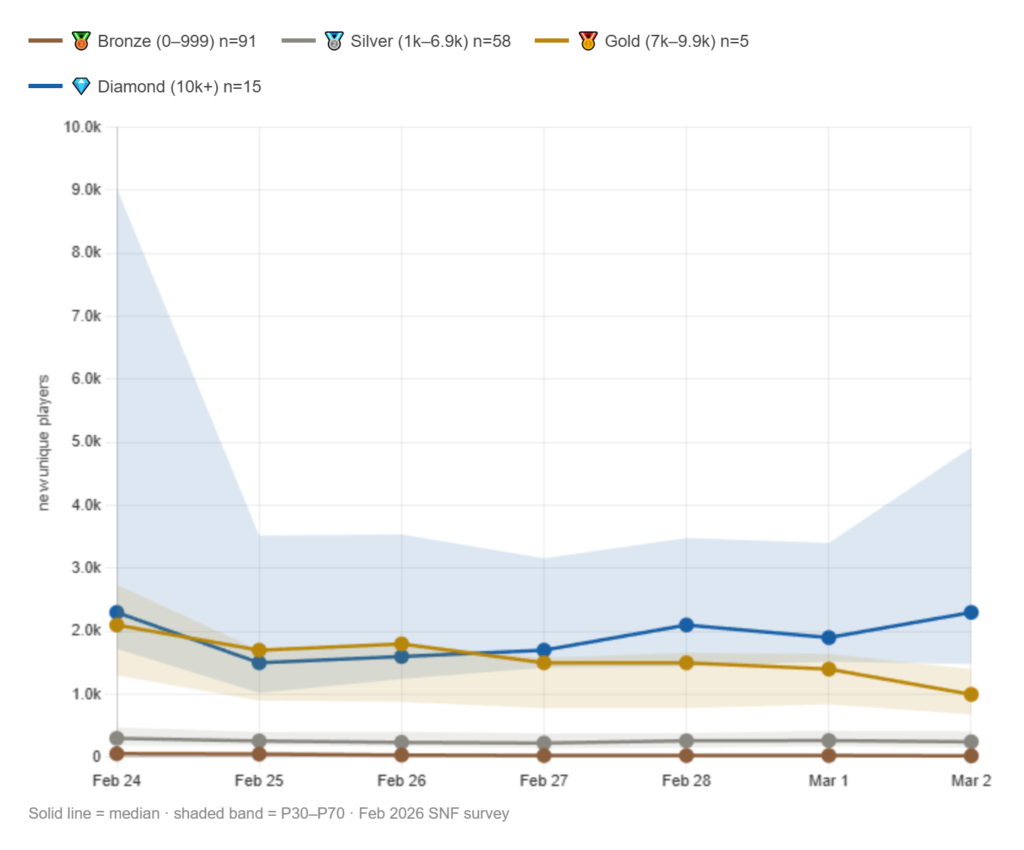
When graphing the daily impression data for all the tiers together I can see the algorithm deciding which games to promote and which games to hide.
Look at Feb 23 and Feb 24 – the algorithm shows most games around the same amount with just under 25,000 impressions.
BUT then by day 3 the Steam algorithm has made a decision. The Bronze and Silver games get less and less visibility while the Gold and Diamond games get shown more and more.
Note in the graph the shaded areas around the lines show the top and bottom values, the line is the median. On February 24th all the shaded areas are touching. There is high variance in the tiers as the algorithm shows them around. But by Feb 25th the shaded areas separate and more and more each day.
Note that Feb 23 is day 1 and SNF starts at 10AM PST so it is always very low. Feb 24 is a full 24 hours of visibility. Similarly March 2nd is the last day and SNF page is hidden by 10 AM.
Note, gold tier really only has 5 people. Really gold tier is just bottom tier diamond. What this means to me is Steam picks winners fast. You are either a Valve favorite and they give you all the visibility or you are nothing to them and they hide you. There is no “middle class” on Steam.
How many total players
This graph shows the number of players a game typically has during each day of the festival.
Interestingly if you look at the previous chart that shows impressions there is a real spike on day 3 and 4. You don’t see that in the player chart. Really the number of players is quite consistent through SNF. Diamond tier does rise by the very end as people flock to the “top charts” to see what the best games of the festival are.
Also look at how in the first 3 days the gold and diamond tier games basically overlap in player counts. But throughout the fest the diamond tier games pull away as the “Top Demo” charts lock in and it becomes a self-perpetuating cycle.
Demo quality ratio
At the end of Steam Next Fest Valves generates this cool little report for your game that shows the venn diagram of how many people wishlisted vs played your demo.
It does disappear after a few weeks so if you participate, be sure to grab a screenshot of it right away.
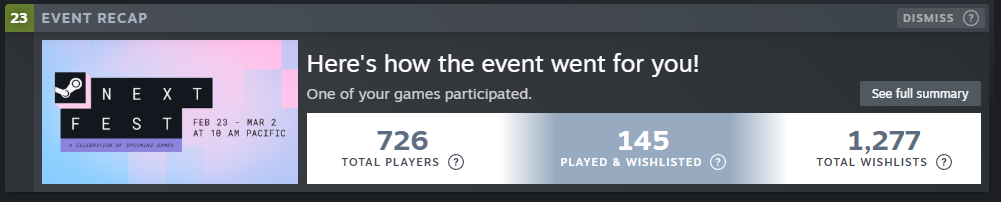
I could never find a pattern to this data. But then Claude code took a look and found a pattern by looking at the ratio of people who played and wishlisted over total player base. Here is the simple formula to calculate it that I call “Demo conversion rate”
Demo conversion rate = (Played & wishlisted) / (Total Players)
So for the game shown in this example screenshot above, the conversion rate is 145/726 which = 19.9%
This Demo Conversion Rate has a moderate correlation (r=0.457) to total SNF wishlists earned. The number of wishlists before Steam Next Fest and velocity is a stronger correlation, but it is something interesting to look at.
Here is a chart of the Demo conversion rate and the ranges of wishlists earned by the games in my survey:
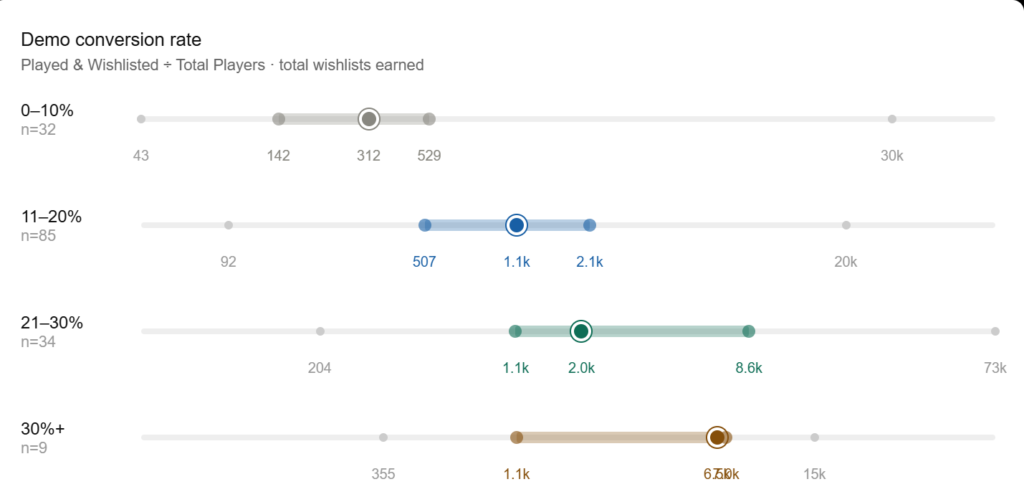
The magic number for Demo conversion rate seems to be about the 20% range.
30th percentile = 12%
Median = 16.33%
70th percentile = 20%
Remember, the median steam game fails so it is better to look at the 70th percentile.
But this ratio isn’t destiny. I saw many games that had a low ratio in the <10% range but still earned tens of thousands of wishlists. See in the 0-10% line, there is an outlier that earned 30K wishlists in Next Fest. It’s a co-op game.
In fact most of the top-earning wishlist with low Demo Conversion rate games were cooperative friend/slop games. One of the hottest genres out there on Steam. My theory is that it comes down to the nature of co-op.
My theory is there is always one friend in a group that is a HARD CORE tastemaker who wishlists a lto of games, plays a ton of demos, and buys a ton of games. The tastemaker brings 2-4 friends into co-op demos. Those friends aren’t hard core Steam wishlisters so just trust the tastemaker’s recommendation and play without wishlisting. When the game comes out, the tastemaker will tell his friends to go buy it and they will because they want to hang out with him. It is almost like a co-op wishlist counts as 4 wishlists (assuming the game is good).
What about low-ratio non-co-op games?
I did a bit of qualitative research and read demo reviews for non-co-op games with very low Demo conversion rates. A common thing I saw was feedback like “Man this game wasn’t what I was expecting” or “this game looked like a casual game but is very hard” or “This game looks great but is super janky.”
My theory is that low demo conversion rates are for games that attract a lot of attention with their looks and theme but in some way or another disappoint the player so they leave without wishlisting it.
The Demo Conversion ratio isn’t a predictor of success, but it could indicate something might be wrong that you need to address. Listen to what the reviewers and people chatting on Discord are saying about your game.
Steam page quality ratio
On the flip side of Demo conversion rate is the ratio of people who played & wishlisted over the total wishlisters.
I call this the “Page conversion rate” = Played & Wishlisted ÷ Total Wishlists
Maybe we should call this the “game intrigue” stat.
To filter out “hobbiest” games, I looked at only the games that earned 1000 wishlists or more in my survey
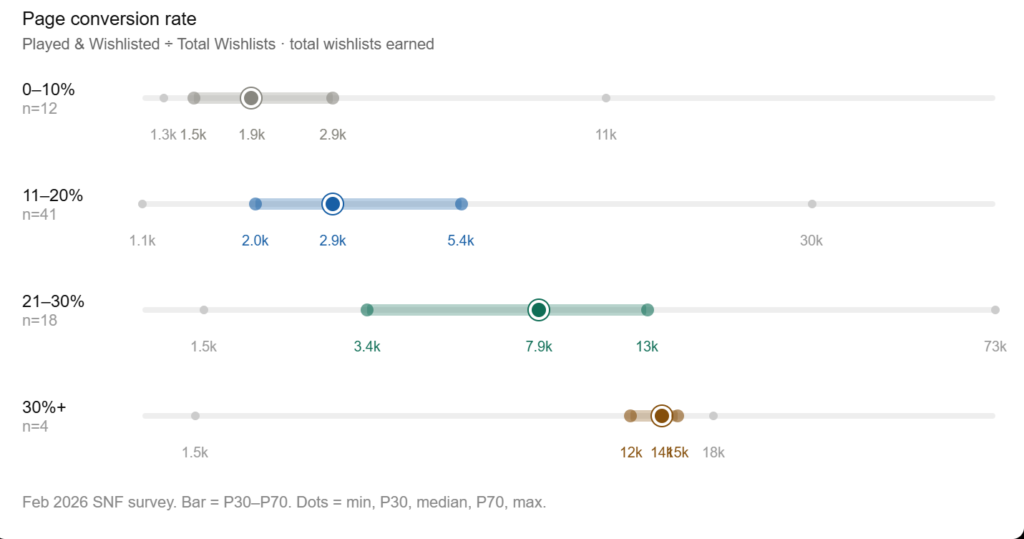
Again, it looks like the sweet spot is in the 20-30% range.
How long before you launch the demo
My general advice is you should launch your demo way before Steam Next Fest because it gives you time to polish and improve it before the big show.
I asked in the survey how long before SNF the demo was launched.
If you look at demos that debuted before the window of SNF promotion you can see it is quite dramatic. In general a game earned 2.5x more wishlists when it was launched much earlier than Steam Next Fest.
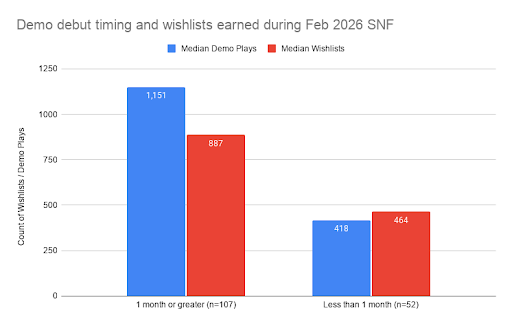
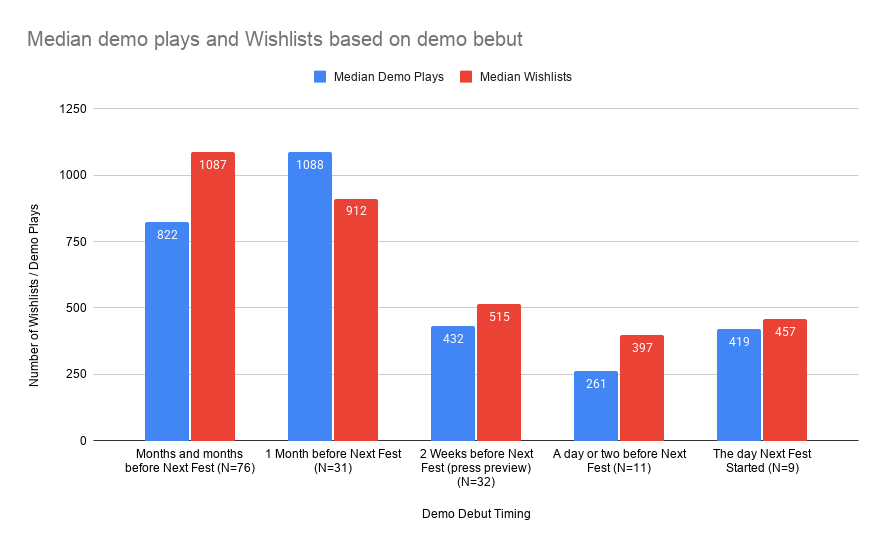
The correlation here is r = −0.205. This is weaker and means there is a lot of overlap between the class of games at each release timing. There are some games in the <1 month camp that did quite well.
You can see this overlap when I subdivide the different buckets.
Separate or same page?
Ah the eternal question. Should you create a separate page for your game’s demo or just publish it to the main page.
The answer to this largely depends on how many wishlists you have leading into Steam Next Fest.
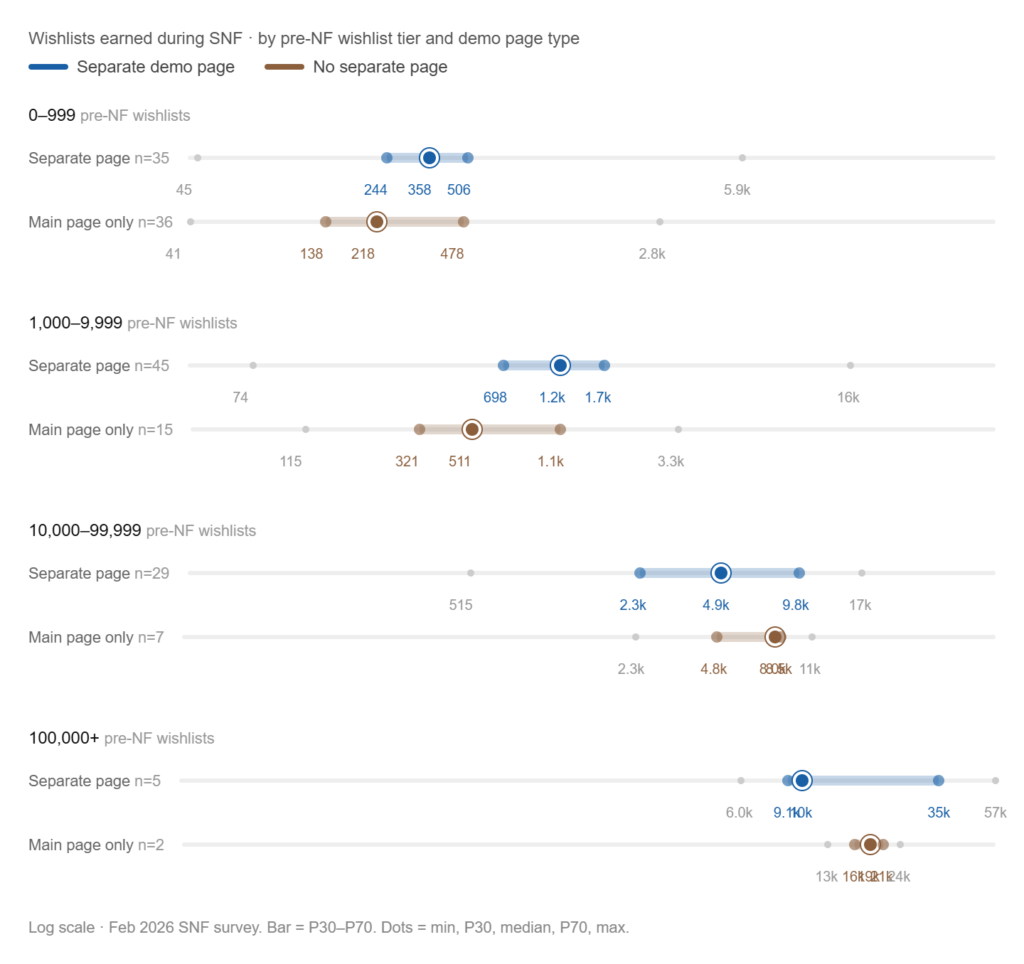
For games entering nextfest with fewer than 10,000 wishlists it doesn’t seem to matter. There seems to be a slight advantage to doing a separate Steam page.
But then when you look at the above chart for a game with more than 10,000 wishlists it seems like there is a higher variance of the number of wishlists earned. Look closely at the number of games that have the demo on main page. At the upper tiers it is more common to do a separate demo page.
My theory is that people who understand Steam, study it, are making games that are getting a lot of wishlists have learned that there are benefits to putting up a separate page (that is my recommendation.)
It could be that if you are proud of your game you are more likely to put a separate page up and leave yourself open to reviews. If a developer knows deep down their game is a bit janky, they might be more likely to keep it on the main page to avoid bad reviews.
I still don’t think it makes a difference, but my advice is to have a separate steam page so you can get feedback and reviews from players.
Summary
Next week I will deep dive into trends about how Steam Next is performing. But based on this data I still don’t see too much of a change in the overall “Meta” of Steam Next Fest
- Make a good game
- Release your demo way before Steam Next Fest and make sure it is a good demo. Be sure to remove everything that is bad in the demo.
- Don’t shadow drop your demo.
- Separate steam page for your demo.
- At minimum 2000+ wishlists before SNF seems to leave you open to performing better.
If you did participate in Steam Next Fest and want to see how your game performed compared to the games in my survey, enter your data in the following tool:
Appendix
Other Steam Next Fest Recaps